Support and resistance using open interest is one of the most practical ways to read the option chain. Many traders can see large OI numbers in the chain, but the real challenge is understanding which levels matter, which ones are old, and which ones are still active.
When OI is read correctly, it helps show where call-side pressure is concentrated, where put-side support is stronger, and which strike zones deserve more attention than others.
What support and resistance mean in OI terms
In simple market terms:
- support is the zone where downside pressure may meet stronger defence
- resistance is the zone where upside movement may meet stronger overhead pressure
In the option chain, these zones are often estimated through strike-wise open interest.
A strike with heavy put-side concentration below spot is often treated as a support zone. A strike with heavy call-side concentration above spot is often treated as a resistance zone. But a proper reading also needs:
- spot price context
- distance from spot
- change in OI
- nearby strike clustering
- market activity
That is why OI-based support and resistance should be treated as a working structure, not as a guaranteed boundary.
Why put OI is used to identify support
Put-side OI is usually watched at strikes below the current market price. When put open interest is high at a nearby strike, traders often read that level as a possible support zone.
This interpretation becomes stronger when fresh put additions are also visible at that strike. In that case, the market is not only carrying old support interest there, but also building new support at the same level.
Practical support reading using put OI
- high put OI below spot often points to a visible support zone
- strong fresh put additions near spot often strengthen immediate support
- nearby put-heavy strikes usually matter more than distant strikes
- support is better read as a zone than as one exact number
Important caution
High put OI does not mean support will always hold. It only tells you that the strike is important on the put side.
Why call OI is used to identify resistance
Call-side OI is usually watched at strikes above the current market price. When call open interest is heavy at a nearby strike, traders often treat that level as resistance or overhead pressure.
This reading becomes stronger when fresh call additions are also visible at the same strike.
Practical resistance reading using call OI
- high call OI above spot often points to a visible resistance zone
- strong fresh call additions near spot can harden that overhead level
- nearby strikes are usually more useful than distant strikes for current structure
- resistance often forms as a cluster, not just one number
Important caution
High call OI is not an automatic sell signal. It simply shows that a strike has become important on the upside.
Why total OI is not enough on its own
One of the biggest mistakes in support and resistance using open interest is to focus only on total OI.
Total OI tells us where positions already exist.
Change in OI tells us where fresh positions are being added or reduced.
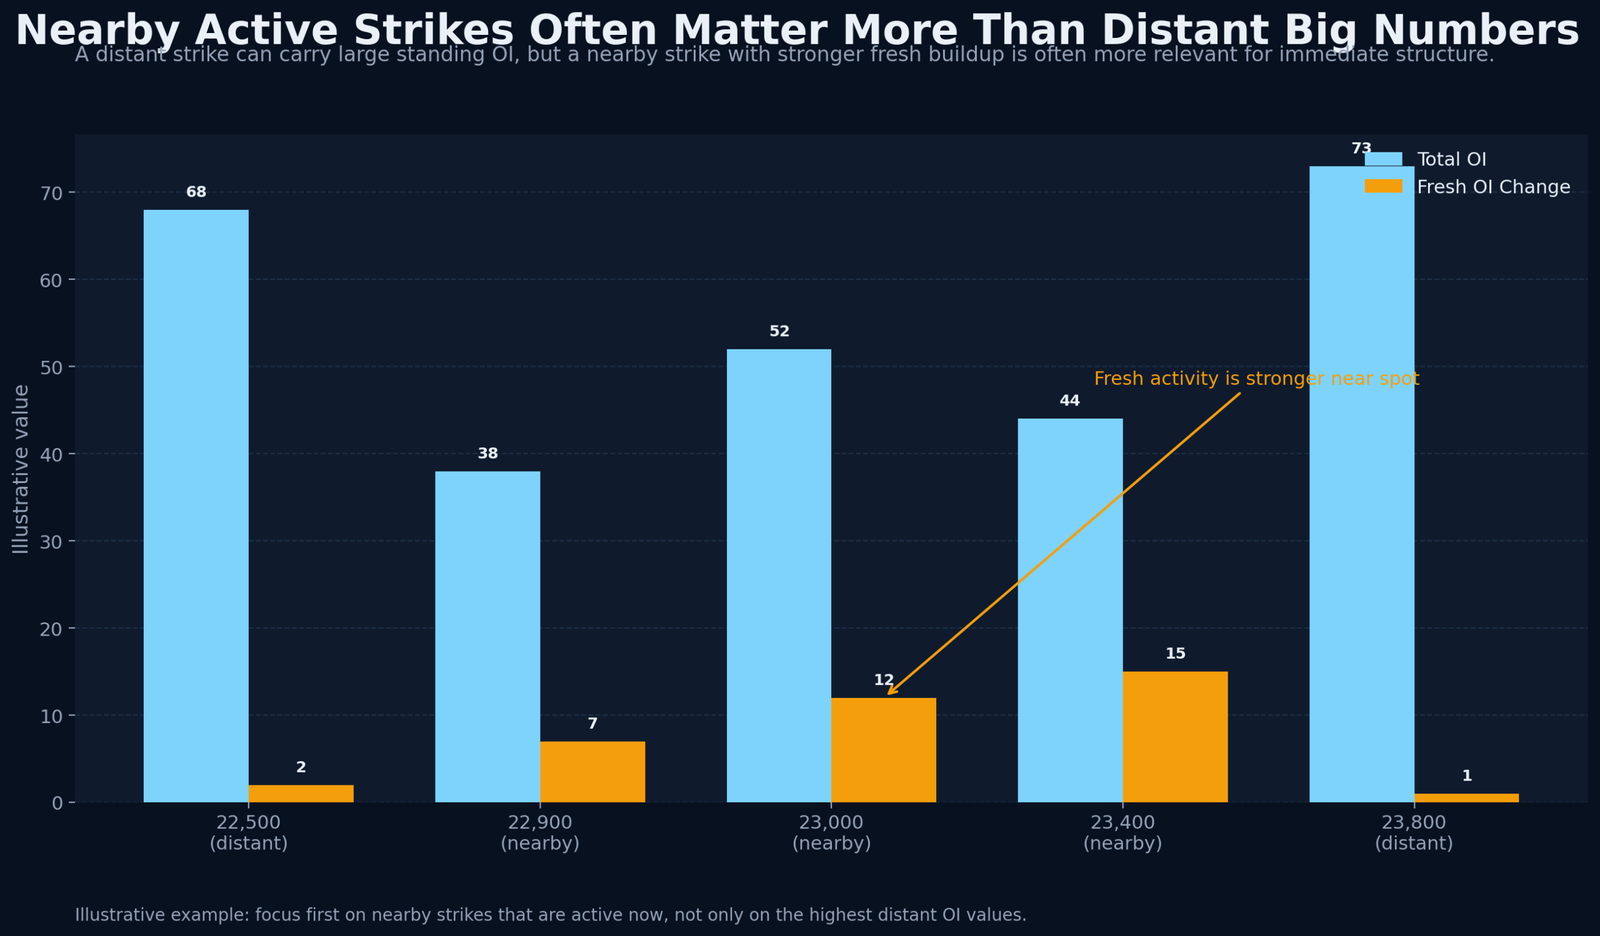
A strike may carry the largest total OI, but a nearby strike with stronger fresh buildup may matter more for the current market structure.
That is why both numbers should be read together.
The chart below should be read in that context. It compares standing OI with fresh OI change so that the difference between old positioning and new activity is easier to understand.
How to identify the most relevant support and resistance levels
A practical method is more useful than simply chasing the biggest number in the chain.
Step 1: Note the current spot price
Without spot price, the chain has no proper context.
Step 2: Mark the strongest put OI strikes below spot
These usually form the first support map.
Step 3: Mark the strongest call OI strikes above spot
These usually form the first resistance map.
Step 4: Check fresh OI additions at nearby strikes
This helps show where new support or pressure is building.
Step 5: Focus on nearby clusters
The nearest active zone is often more useful than a distant extreme.
Why nearby strikes matter more than distant strikes
A distant strike may carry large standing OI, but that does not always make it the best current support or resistance reference.
A nearby strike with meaningful fresh buildup is often more relevant because it shows where participants are currently concentrating around the live market.
This is especially useful in weekly option structures and short-term market reading.
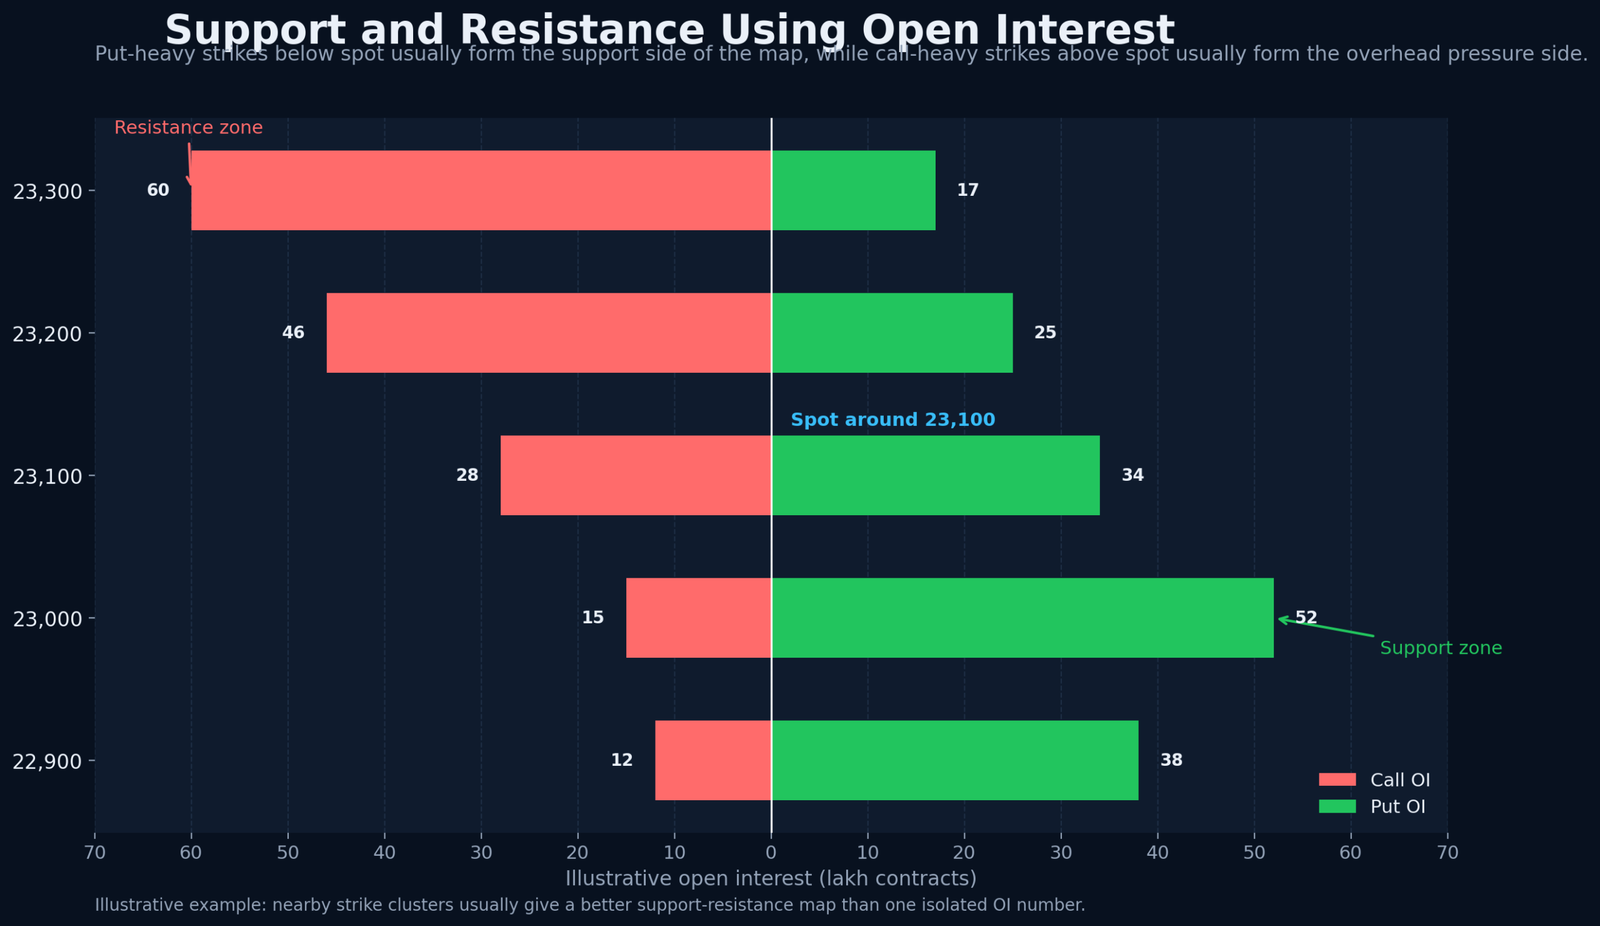
Strike clusters are often more useful than one exact level
Support and resistance in the option chain often work better as zones than as exact points.
That means:
– several nearby put-heavy strikes can form a support band
– several nearby call-heavy strikes can form a resistance band
This is one reason why cluster reading is stronger than one-number reading.
The visual below should be read as an illustrative map. It shows why support is often better understood as a put-heavy zone below spot, while resistance is often better understood as a call-heavy zone above spot.
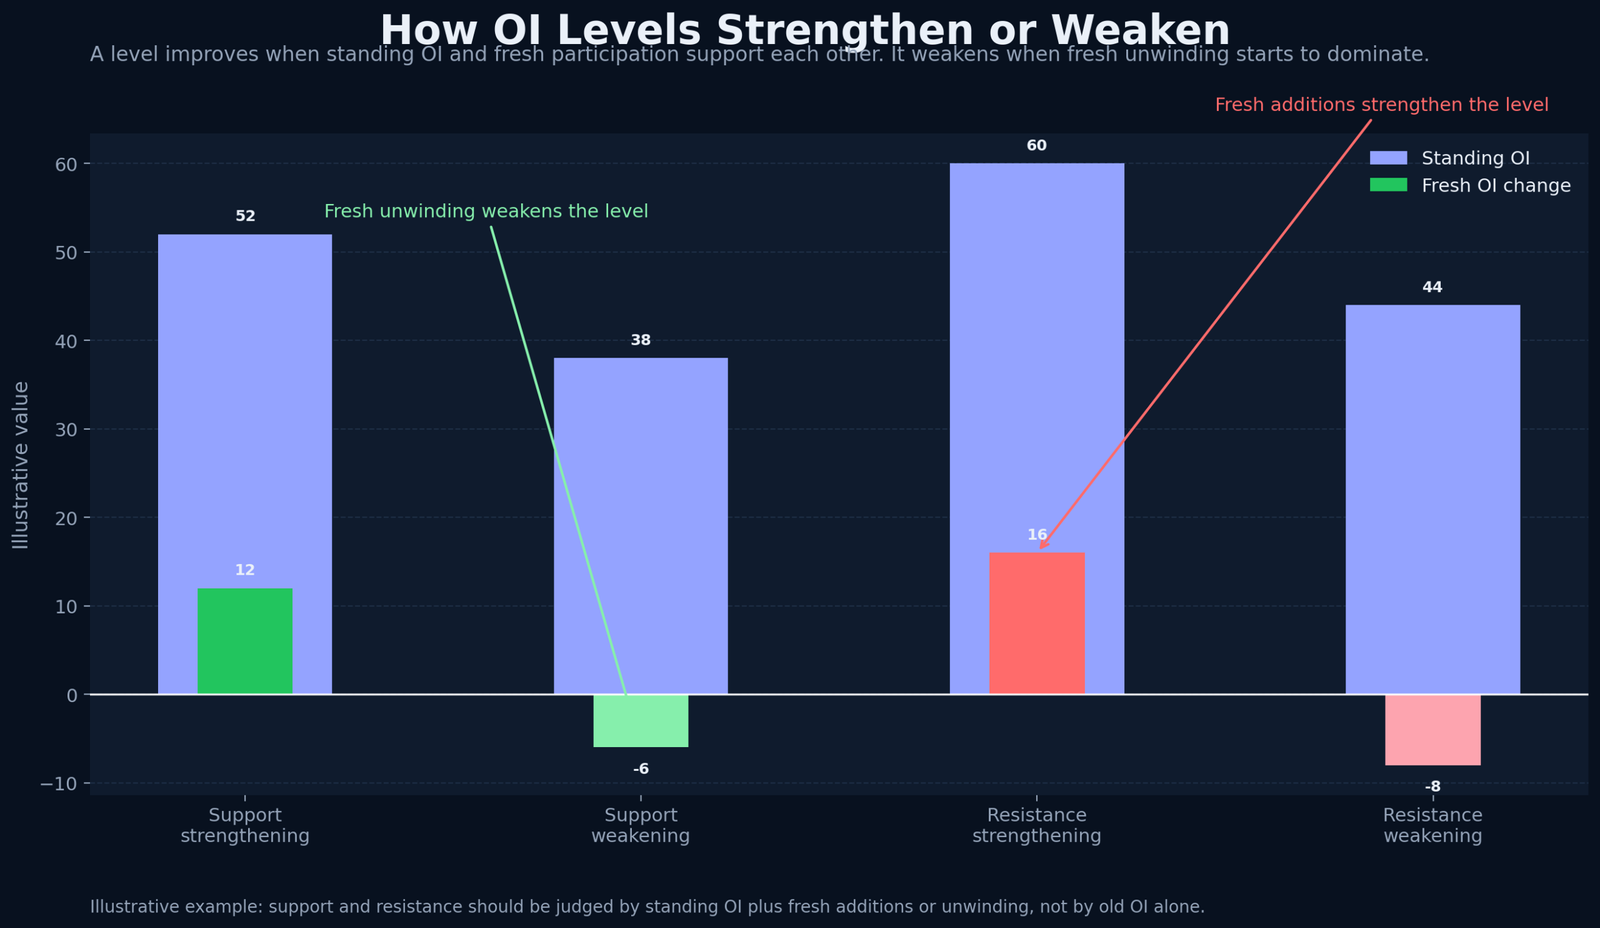
How to judge whether support or resistance is strengthening
A level becomes stronger when fresh participation continues to build around it.
Support may be strengthening when:
- put OI is high below spot
- fresh put additions are increasing near spot
- nearby put-heavy strikes are forming a stronger cluster
- price is still holding above the zone
Resistance may be strengthening when:
- call OI is high above spot
- fresh call additions are increasing near spot
- nearby call-heavy strikes are forming a stronger cluster
- price keeps failing below the zone
How to judge whether support or resistance is weakening
A level can weaken even if it was important earlier.
The visual below should be read as a strengthening-versus-weakening map. It is meant to show how fresh additions, unwinding and location around spot change the quality of a support or resistance zone.
Support may be weakening when:
- put OI at the key strike starts unwinding
- fresh put additions shift lower instead of staying near spot
- price moves below the support zone with strength
Resistance may be weakening when:
- call OI starts unwinding at the key strike
- fresh call additions stop building near spot
- price starts moving through the overhead cluster with more strength
Practical example of support and resistance using OI
The table below is illustrative. It is meant to show the reading method clearly.
| Strike | Call OI | Change in Call OI | Put OI | Change in Put OI | Practical reading |
|---|---|---|---|---|---|
| 22,900 | 12 lakh | +1 lakh | 38 lakh | +2 lakh | Support exists, but it is not the strongest zone |
| 23,000 | 15 lakh | +2 lakh | 52 lakh | +8 lakh | Strong support zone with fresh put buildup |
| 23,100 | 28 lakh | +12 lakh | 34 lakh | +4 lakh | Transition zone near spot |
| 23,200 | 46 lakh | +18 lakh | 25 lakh | +2 lakh | Resistance zone above spot |
| 23,300 | 60 lakh | +22 lakh | 17 lakh | +1 lakh | Stronger overhead call-side pressure |
What this table shows
- 23,000 stands out as the stronger support zone because put OI is high and fresh put additions are also meaningful.
- 23,200 and 23,300 stand out on the upside because both call OI and fresh call additions are strong there.
- 23,100 behaves more like a transition strike because activity is visible on both sides.
Illustrative reading framework
| Observation | Likely reading | What to check next |
|---|---|---|
| High put OI below spot | Possible support zone | Check fresh put additions and proximity to spot |
| High call OI above spot | Possible resistance zone | Check fresh call additions and nearby clusters |
| Strong fresh put additions near spot | Immediate support may be strengthening | Check whether price is holding above the zone |
| Strong fresh call additions near spot | Immediate resistance may be strengthening | Check whether price is failing below the zone |
| OI unwinding at a key strike | The level may be weakening | Check the next nearby strike or cluster |
| Distant high OI but weak fresh change | Legacy level, not always the best current signal | Focus on nearer active strikes |
Common mistakes while using OI for support and resistance
| Mistake | Why it is weak | Better reading approach |
|---|---|---|
| Using only the highest OI strike | The biggest number is not always the strongest current level | Compare total OI with fresh OI change |
| Ignoring spot price | A distant strike may look important but may not matter immediately | Start with the strikes nearest to spot |
| Treating support or resistance as one exact number | OI often works better in zones | Read nearby strike clusters |
| Ignoring change in OI | Old OI can mislead the reading | Always compare standing OI with fresh additions |
| Assuming support and resistance must hold | OI levels are clues, not guarantees | Watch whether the level is strengthening or weakening |
| Ignoring volume and context | OI without activity can be stale | Use OI with market context |
A simple framework traders can use
If you want a clean practical method, follow this sequence:
- note the current spot price
- identify the strongest put OI strikes below spot
- identify the strongest call OI strikes above spot
- check fresh OI additions near the market
- focus on nearby clusters rather than distant extremes
- judge whether the level is strengthening, weakening or simply carrying old positions
This gives a more disciplined reading than looking only at the single highest strike on each side.
How OI-based support and resistance should be used
Support and resistance from OI should be used as a market-structure tool.
They help answer:
– where the market is likely to find support
– where overhead pressure may appear
– whether current positioning is shifting higher or lower
They should not be used as automatic prediction points.
The strength of this method lies in structure, not certainty.
Conclusion
Open interest is one of the most practical ways to identify support and resistance in the option chain.
The most useful reading comes from combining:
– total OI
– change in OI
– distance from spot
– nearby strike clusters
– whether a level is strengthening or weakening
That is what turns a raw option chain into a better support-resistance framework.
If you want the broader reading method behind these levels, the guide on how to read option chain using open interest is the next natural step.
