Long build up, short build up, long unwinding and short covering are four of the most common terms used in open interest analysis. Traders hear these phrases often, but many still confuse them because they focus only on price direction.
That is where the real misunderstanding begins.
A rising market can come from fresh bullish positions or from bearish positions getting closed. A falling market can come from fresh bearish positions or from bullish positions getting exited. So price alone is not enough.
The better way is to read price together with open interest.
This article explains the difference between all four setups, how traders usually identify them, which ones often show fresher conviction, and where these readings can become misleading.
Why traders get confused by these four terms
The confusion is common because:
– two setups can show rising price
– two setups can show falling price
– the words long and short pull attention away from what OI is actually saying
– many traders memorise the 4-box matrix without understanding the type of participation behind the move
The better way to think about the topic is this:
- price shows direction
- open interest helps show the character of the move
The real goal is to classify what kind of participation is likely happening behind the move.
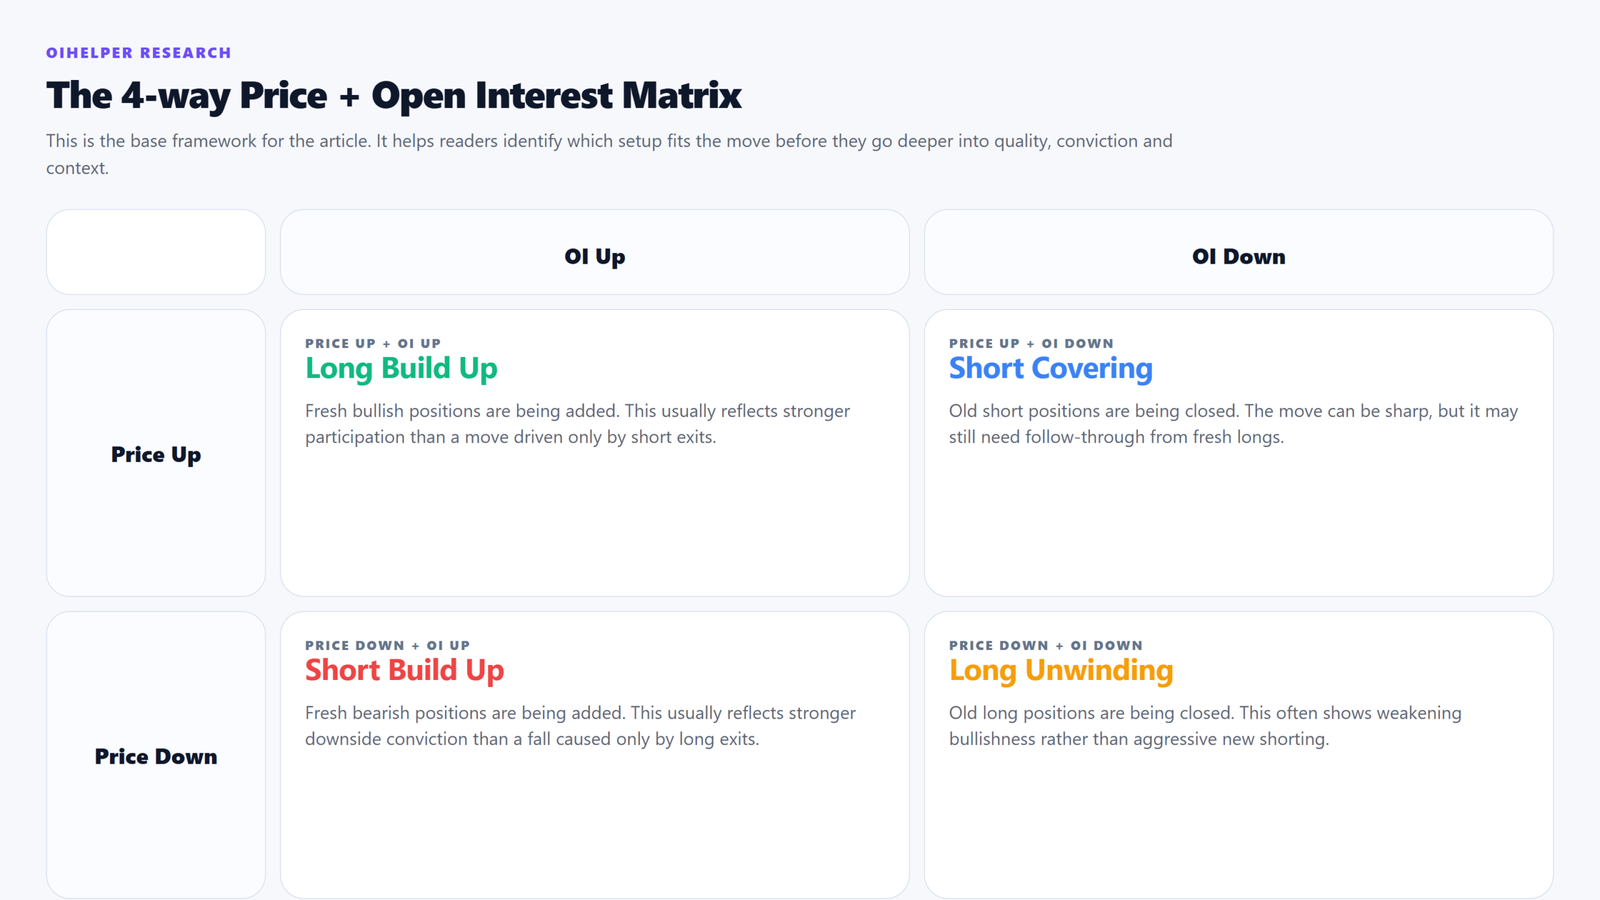
The simple 4-way matrix
The most basic framework looks like this:
| Price | Open Interest | Setup | Broad reading |
|---|---|---|---|
| Up | Up | Long build up | Fresh bullish positions are being added |
| Down | Up | Short build up | Fresh bearish positions are being added |
| Up | Down | Short covering | Existing shorts are being closed |
| Down | Down | Long unwinding | Existing longs are being closed |
This table is correct, but it is only the starting point.
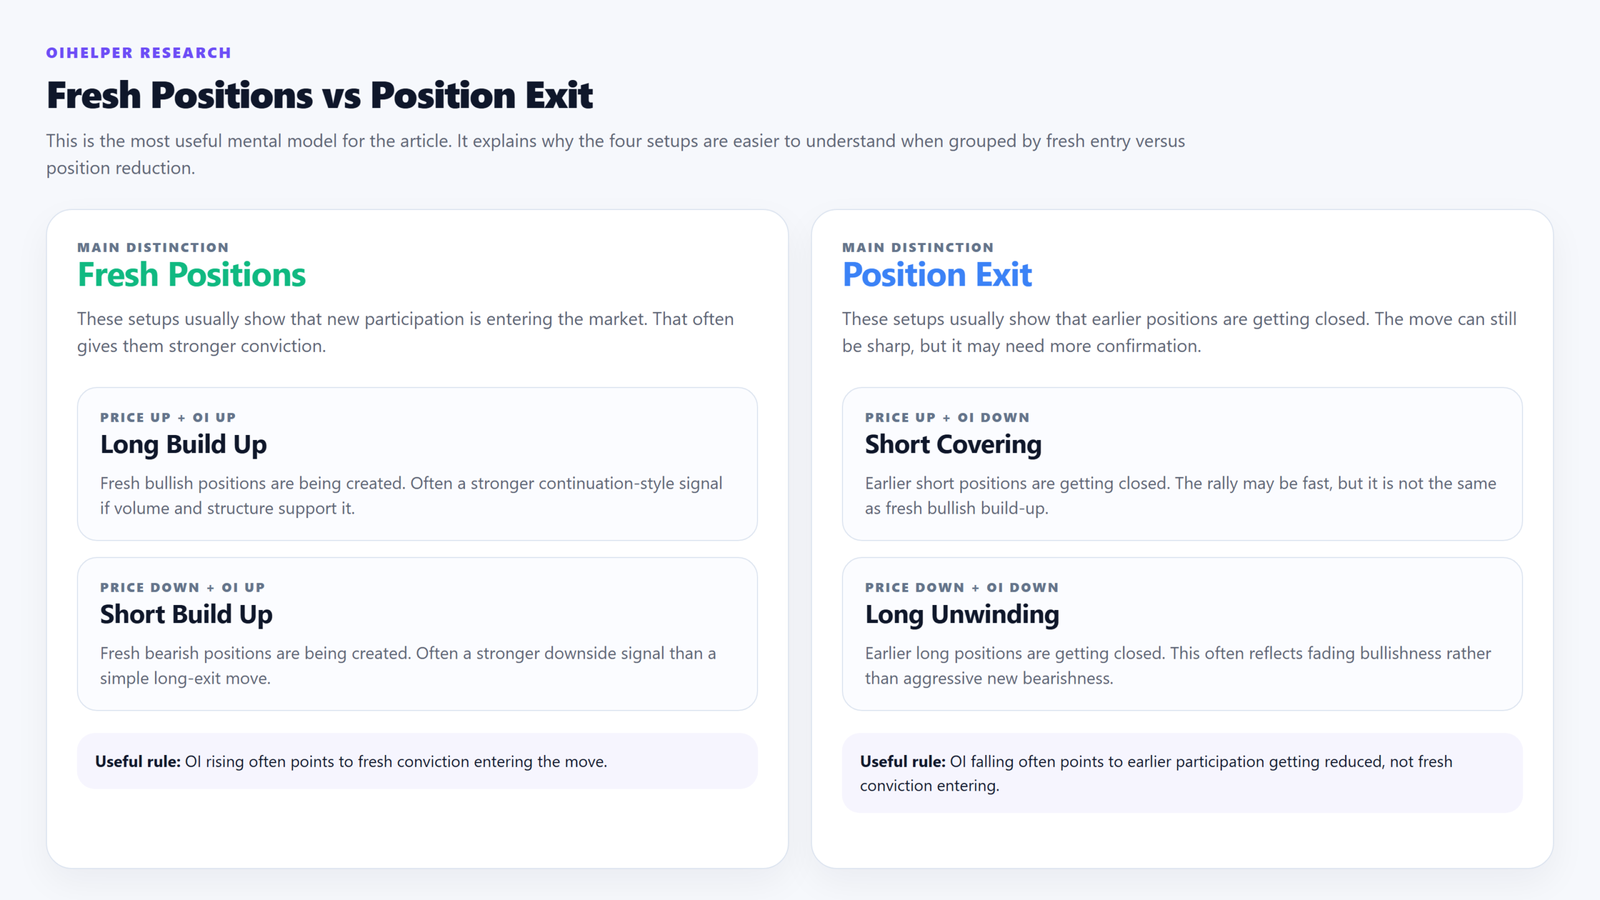
The more useful distinction: fresh positions vs position exit
The strongest way to understand these four setups is not only bullish vs bearish.
It is this:
Fresh positions
- Long build up
- Short build up
Position exit
- Short covering
- Long unwinding
That distinction matters because rising OI usually points to fresh participation, while falling OI usually points to earlier positions getting reduced.
This is also why whether positioning is being added or removed now matters so much in interpretation.
What long build up means
Long build up happens when:
– price rises
– open interest rises
This usually suggests that traders are adding fresh bullish positions.
What it generally implies
- fresh participation is coming on the long side
- the move may have stronger conviction than a simple short-covering bounce
- the trend can continue if supported by volume and market context
What it does not guarantee
- a clean continuation every time
- that the move is safe to chase immediately
- that broader structure automatically supports it
What short build up means
Short build up happens when:
– price falls
– open interest rises
This usually suggests that traders are adding fresh bearish positions.
What it generally implies
- fresh bearish participation is entering
- the move may have stronger conviction than a simple long-unwinding decline
- bearish pressure can continue if the broader setup supports it
What it does not guarantee
- that the move will continue without interruption
- that every fall with rising OI is a high-quality short setup
- that expiry, news or weak participation are not distorting the reading
What short covering means
Short covering happens when:
– price rises
– open interest falls
This usually suggests that earlier short positions are being closed.
What it generally implies
- bearish positions are exiting
- the move can be sharp
- the rally may be driven by short exits rather than fresh bullish conviction
What it does not guarantee
- a strong sustained uptrend
- that fresh long positions have entered in size
- that the rally will continue once the short-exit pressure fades
This is one of the most misunderstood setups. Traders often treat short covering as if it automatically means the same thing as a strong bullish build up. It does not.
What long unwinding means
Long unwinding happens when:
– price falls
– open interest falls
This usually suggests that earlier long positions are being closed.
What it generally implies
- bullish positions are exiting
- the market is weakening because earlier longs are reducing exposure
- the fall may reflect fading bullish conviction rather than aggressive fresh shorting
What it does not guarantee
- that strong bearish conviction is entering
- that the decline will continue with the same force
- that fresh short sellers are actually building large positions
This is another setup traders misread regularly.
Long build up vs short covering
This is the first major confusion pair.
Both setups can show rising price. But they are not the same.
| Factor | Long build up | Short covering |
|---|---|---|
| Price | Rising | Rising |
| OI | Rising | Falling |
| Main driver | Fresh bullish positions | Existing shorts exiting |
| Usual conviction | Often stronger | Can be sharp but may be temporary |
| What to check next | Volume, breakout context, follow-through | Whether fresh long build up follows |
The practical difference
- Long build up usually means buyers are entering with bullish intent.
- Short covering usually means earlier bears are getting out.
A simple way to remember it is:
One move is driven by fresh belief. The other may be driven by fear.
This is why a rally driven by long build up often carries stronger conviction than a rally driven only by short covering.
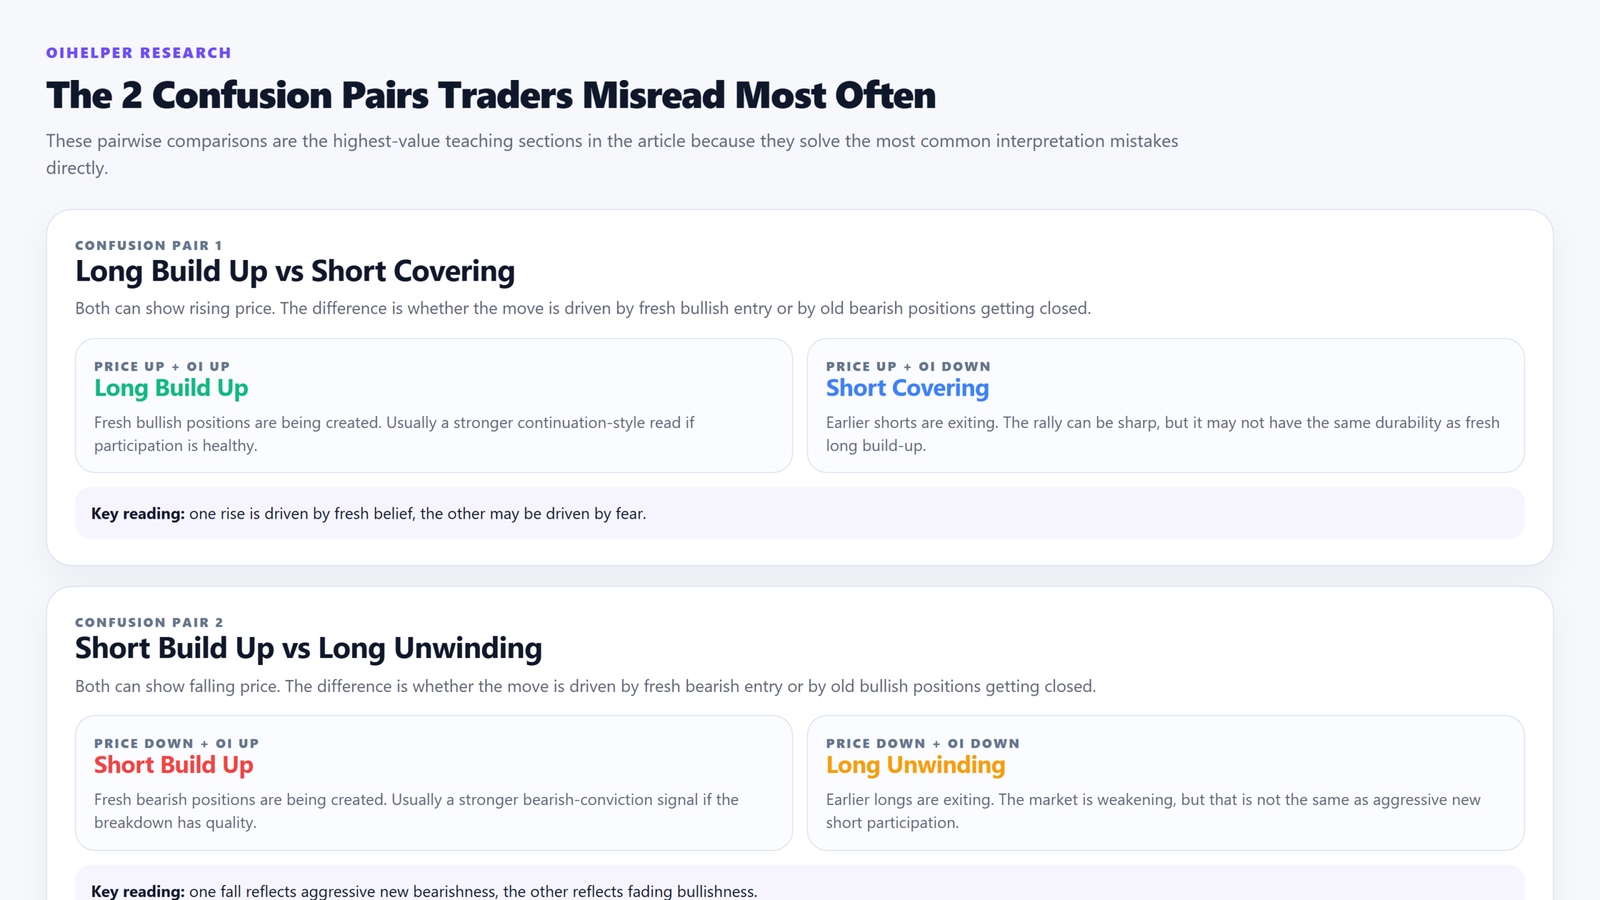
Short build up vs long unwinding
This is the second major confusion pair.
Both setups can show falling price. But they are also different.
| Factor | Short build up | Long unwinding |
|---|---|---|
| Price | Falling | Falling |
| OI | Rising | Falling |
| Main driver | Fresh bearish positions | Existing longs exiting |
| Usual conviction | Often stronger | Can reflect weakening rather than fresh aggression |
| What to check next | Volume, breakdown context, support below | Whether fresh shorts also start entering |
The practical difference
- Short build up usually means new bearish positions are being created.
- Long unwinding usually means earlier bulls are losing confidence and reducing exposure.
A simple way to remember it is:
One move reflects aggressive new bearishness. The other reflects fading bullishness.
This is why a decline caused by short build up often carries stronger bearish conviction than a decline caused only by long unwinding.
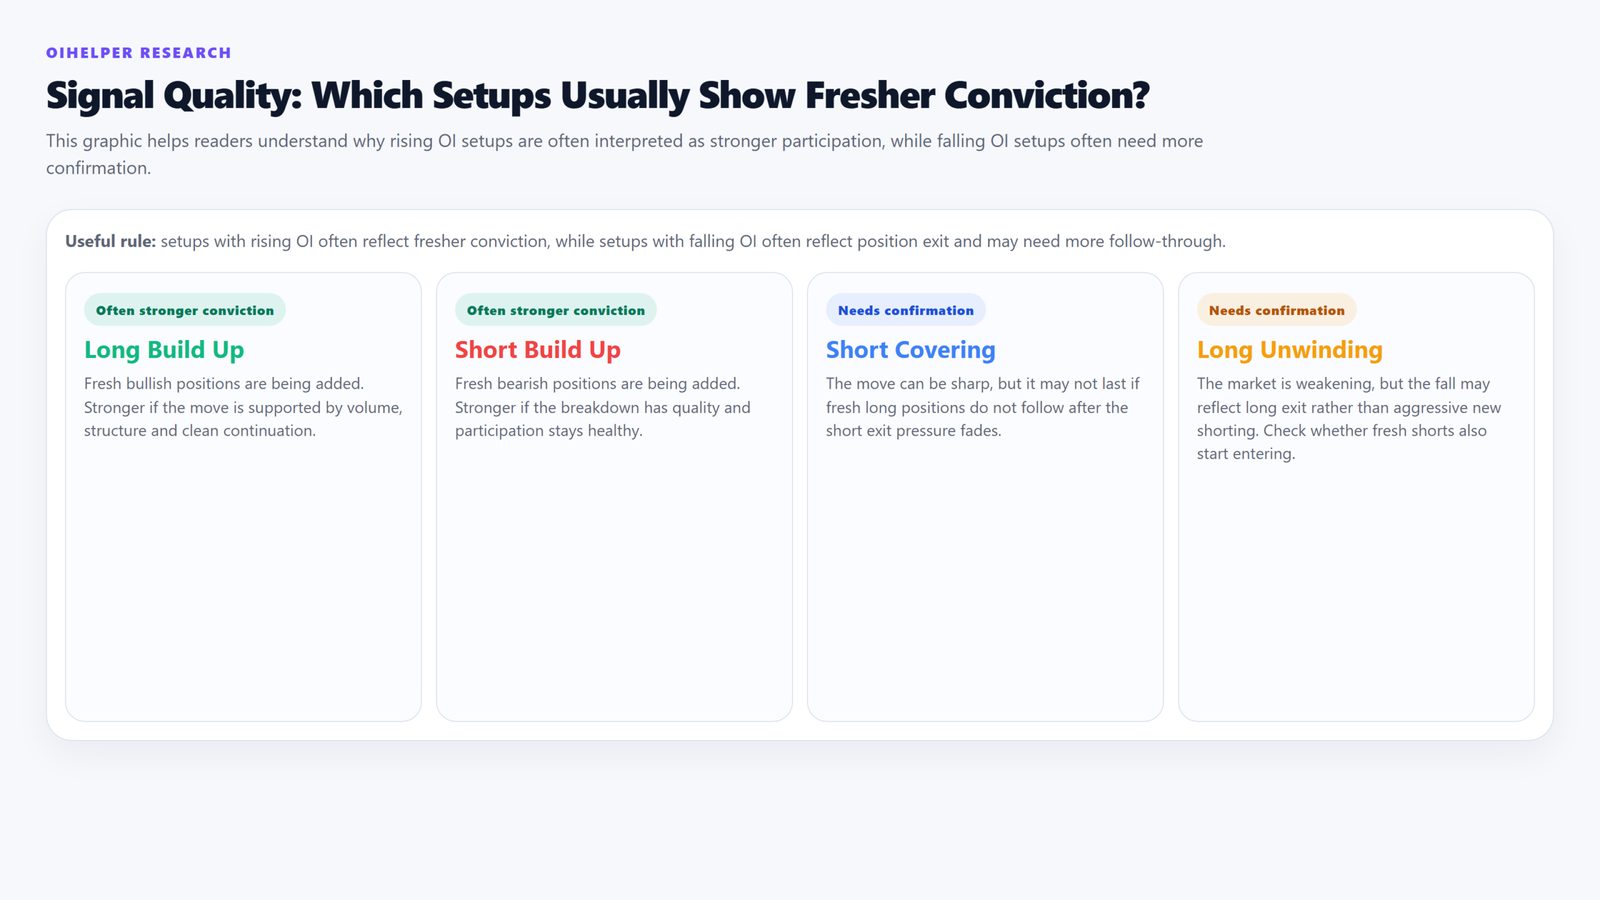
Which setups usually show stronger conviction?
A useful rule is this:
- setups with rising OI often reflect fresher conviction
- setups with falling OI often reflect position exit and may need more confirmation
That means:
– long build up is often stronger than short covering from a bullish-conviction point of view
– short build up is often stronger than long unwinding from a bearish-conviction point of view
This does not make the exit setups useless. It simply means traders should interpret them with more caution.
Why price direction alone is not enough
This is the core lesson of the topic.
- a rising market can be long build up or short covering
- a falling market can be short build up or long unwinding
So price alone tells you what direction the market is moving.
Open interest helps you judge what kind of participation is likely behind that move.
That is why these four labels are useful.
Why these readings can mislead
The four labels are not stand-alone trading signals. They are interpretation frameworks.
That means they can still mislead when:
– volume is weak
– price is moving near a major level
– expiry adjustments distort OI
– news triggers forced exits
– traders apply futures-style labels too casually in options-only interpretation
For example, volume can help confirm whether the move has real participation. A price move with weak participation may not carry the same quality as a move supported by stronger activity.
Futures-style interpretation vs options interpretation
This is an important nuance.
These four labels are most naturally used in price + OI trend reading, especially in futures-style interpretation.
In options, things can become more complicated because strike-level OI may also reflect:
– writing activity
– expiry adjustments
– shifting strikes
– call-side vs put-side positioning
So the framework is still useful, but traders should be careful about using it too loosely in option-chain reading.
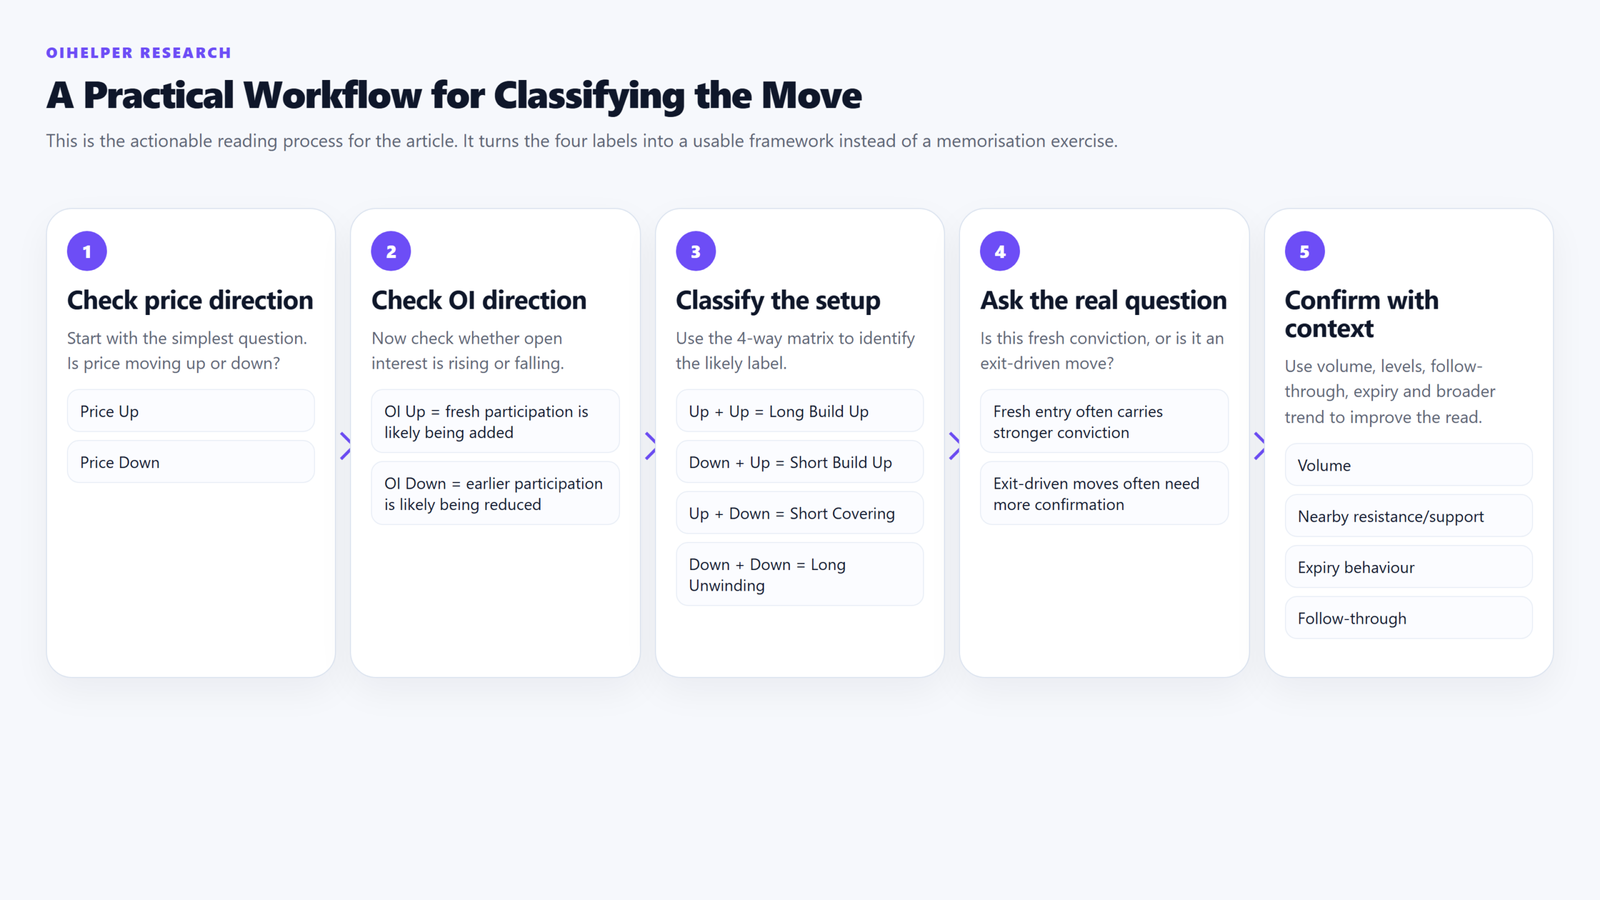
A practical workflow for using these labels
If you want to read open interest in a more structured way, use this simple process:
1. Check price direction
Is price rising or falling?
2. Check OI direction
Is open interest rising or falling?
3. Classify the setup
Use the 4-way matrix to identify the likely label.
4. Ask the more important question
Is this fresh participation, or is it old participation getting exited?
5. Confirm with context
Check:
– volume
– nearby levels
– trend context
– expiry context
– whether follow-through appears after the initial move
That gives a much more reliable interpretation than memorising the label alone.
A practical comparison table
| Setup | Fresh positions or exit? | Broad reading | Often confused with |
|---|---|---|---|
| Long build up | Fresh entry | Stronger bullish participation | Short covering |
| Short covering | Position exit | Bullish move caused by shorts exiting | Long build up |
| Short build up | Fresh entry | Stronger bearish participation | Long unwinding |
| Long unwinding | Position exit | Weakness caused by longs exiting | Short build up |
Signal quality table
| Setup | Typical character | What to confirm next |
|---|---|---|
| Long build up | Often stronger bullish conviction | Volume, breakout quality, follow-through |
| Short build up | Often stronger bearish conviction | Volume, breakdown quality, nearby support |
| Short covering | Can be sharp but sometimes temporary | Whether fresh longs follow, whether resistance caps the move |
| Long unwinding | Can reflect weakening rather than aggressive bearishness | Whether fresh shorts join, whether price breaks key support |
Common mistakes traders make
| Mistake | Why it is weak | Better reading |
|---|---|---|
| Treating every rise as bullish in the same way | Long build up and short covering are different | Check OI direction, not just price direction |
| Treating every fall as bearish in the same way | Short build up and long unwinding are different | Distinguish fresh shorts from long exits |
| Assuming falling OI is always weak | Exit-driven moves can still be sharp | Judge follow-through and context |
| Assuming rising OI is automatically reliable | Rising OI can still fail without quality context | Confirm with volume and structure |
| Applying futures-style labels blindly to options chains | Options OI has added complexity | Use the framework carefully in options reading |
| Using the label as a trade signal by itself | The label is only a classification tool | Confirm with market context before acting |
Conclusion
Long build up, short build up, long unwinding and short covering become easier to understand when traders stop memorising them as four isolated phrases and start reading them as a framework.
The clearest distinction is this:
– long build up and short build up usually reflect fresh positions
– short covering and long unwinding usually reflect position exit
That is why:
– not every rise is bullish for the same reason
– not every fall is bearish for the same reason
Use price to understand direction.
Use open interest to understand the character of the move.
Then confirm the read with volume, levels and context.
That approach is much more useful than relying on the 4-box matrix alone.
the same reason
– not every fall is bearish for the same reason
Use price to understand direction.
Use open interest to understand the character of the move.
Then confirm the read with volume, levels and context.
That approach is much more useful than relying on the 4-box matrix alone.
