How to read option chain using open interest is one of the most useful practical skills in options trading. Many traders already understand what calls, puts and strike prices are, but still find the option chain difficult to interpret because the missing piece is often open interest.
Open interest helps show where positions are concentrated, where fresh activity is building, and which strikes deserve closer attention. When it is read properly, the option chain becomes much easier to understand.
What the option chain shows
An option chain is a strike-wise table of option data. It usually includes:
- call-side data
- put-side data
- strike prices
- last traded price (LTP)
- open interest
- change in open interest
- volume
- implied volatility in many setups
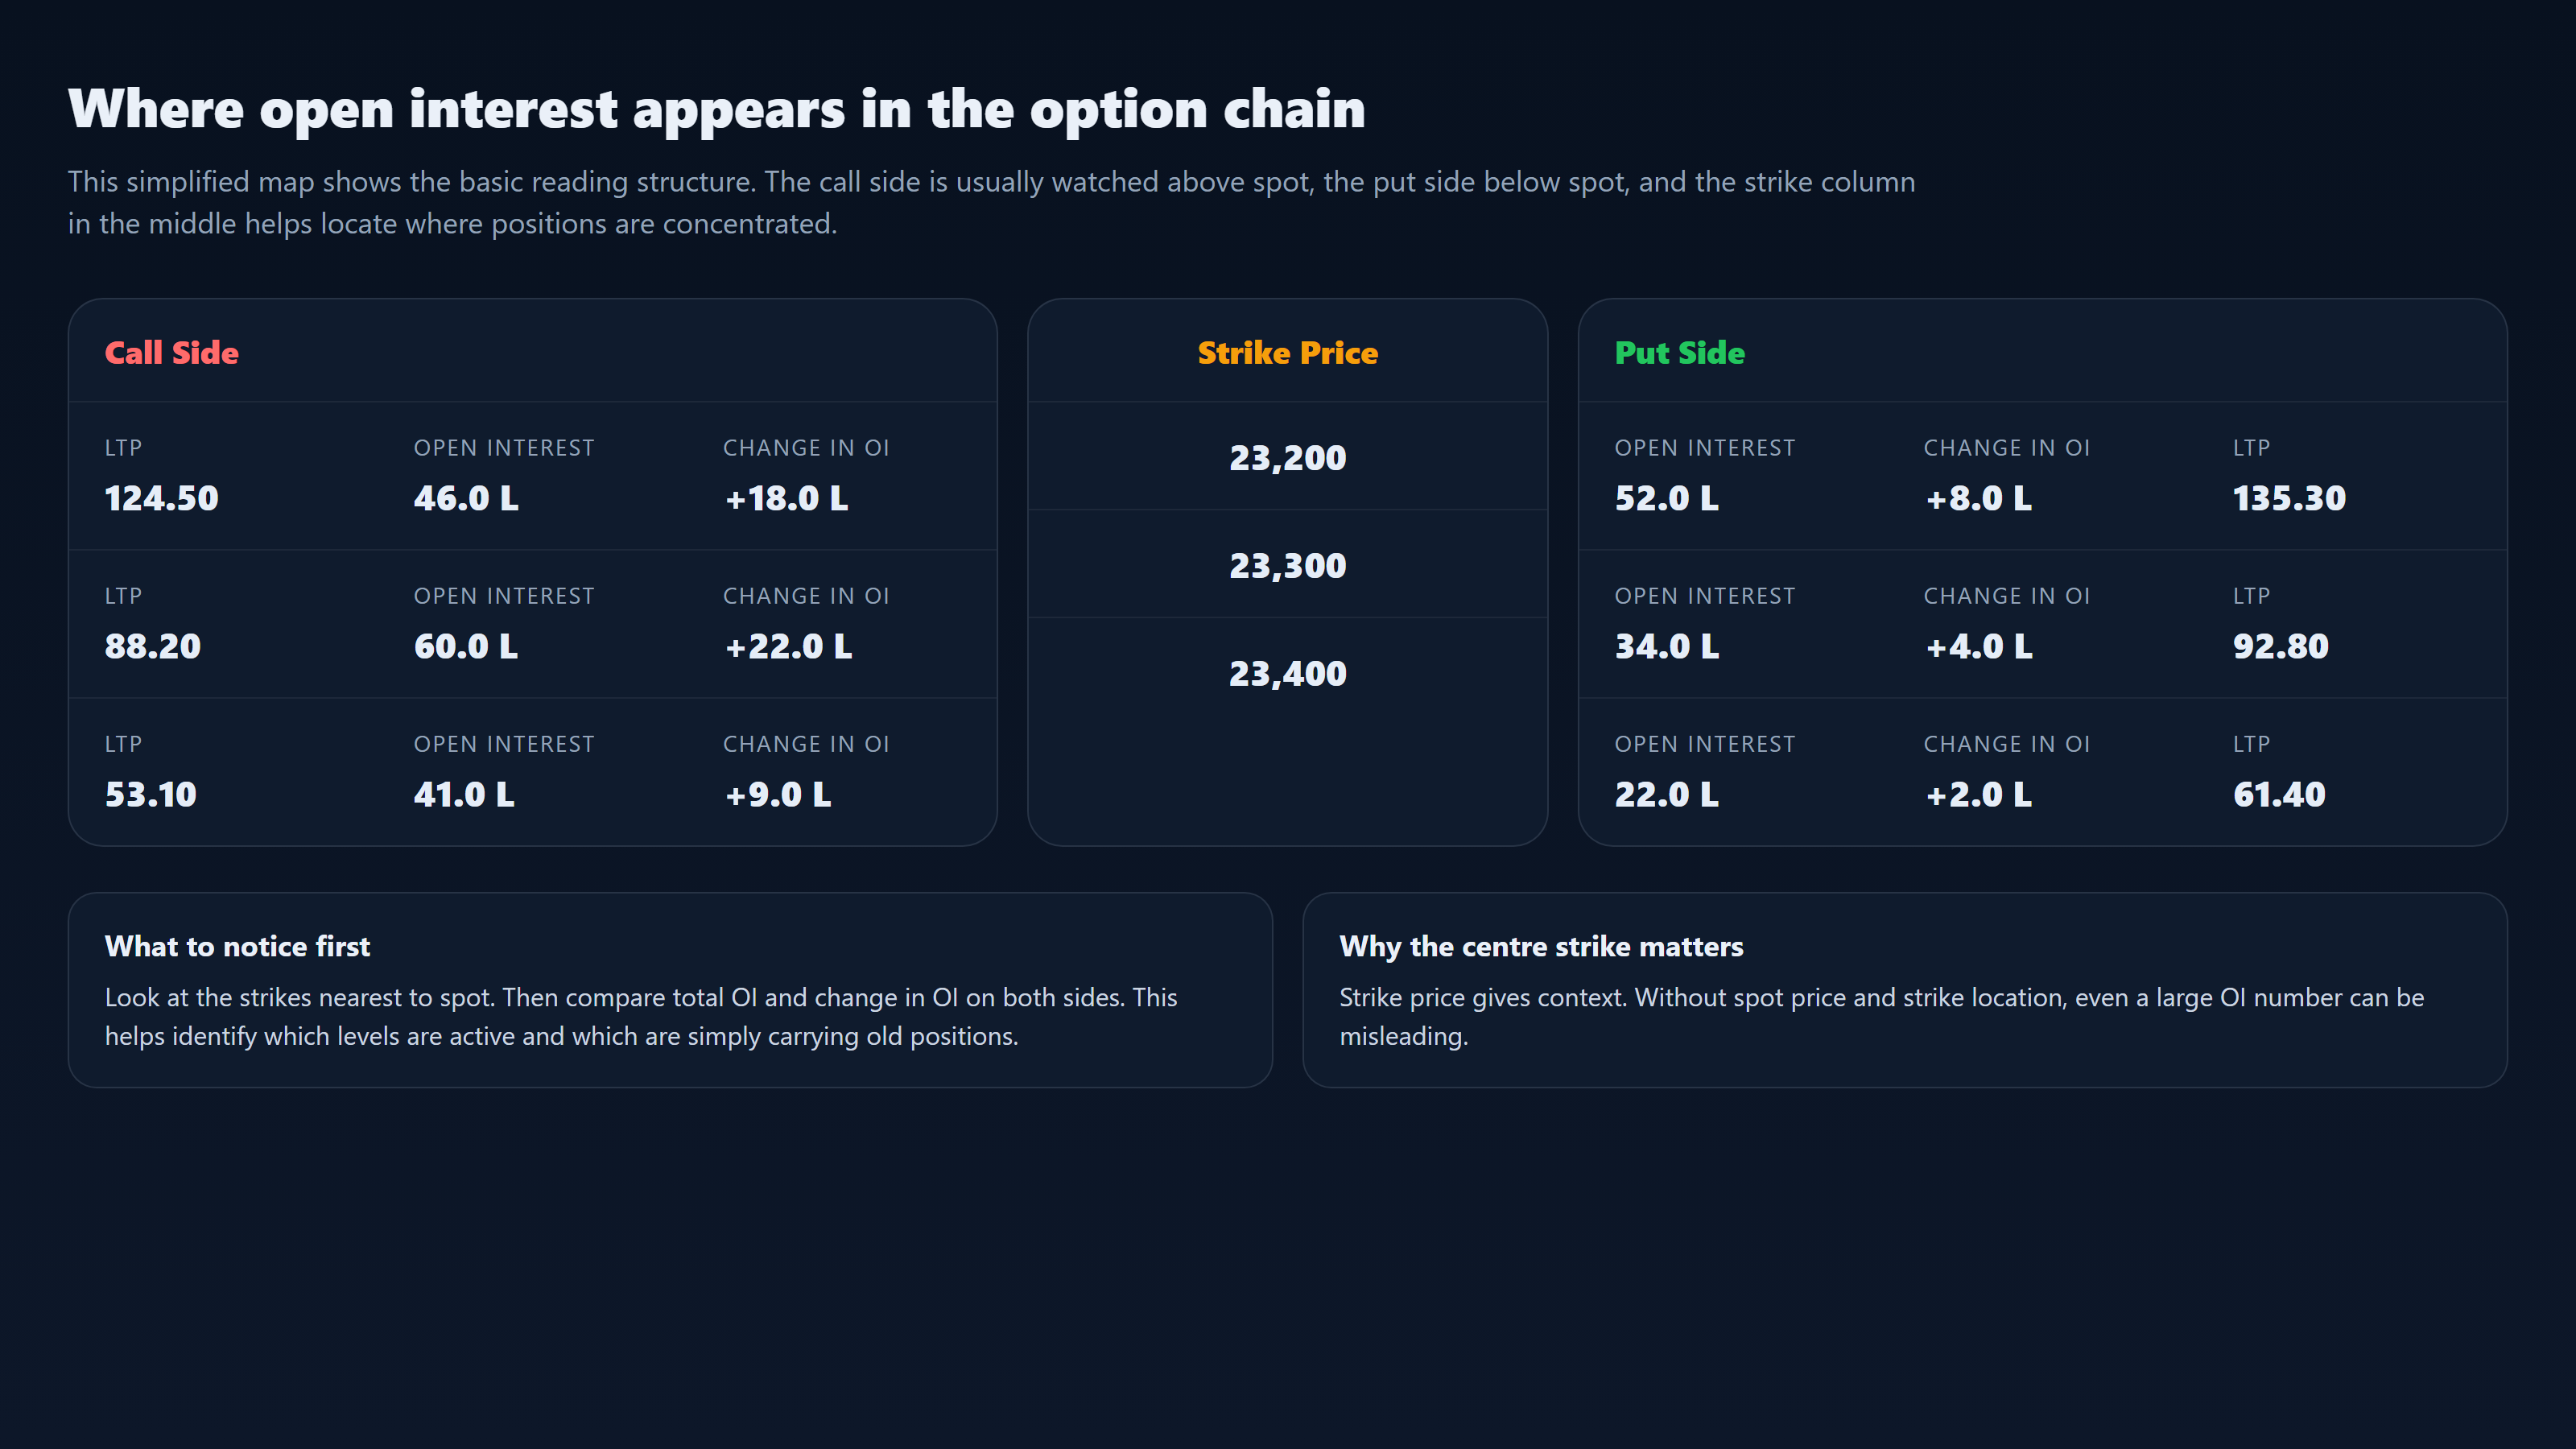
The strike price appears in the centre. Call-side data is shown on one side and put-side data on the other. Once you know the spot price, it becomes easier to identify which strikes are close to the market and which ones are too far away to matter immediately.
In practical terms, the option chain helps answer three questions:
- where the market is trading now
- where the biggest positions are sitting
- where fresh positions are being added
This is where open interest becomes important.
The visual below should be read as a simplified option-chain map. It shows where call-side fields appear, where put-side fields appear, and why the strike column in the centre gives context to every OI reading.
What open interest means in the option chain
Open interest is the total number of open option contracts at a strike. In simple terms, it shows where positions are currently active.
In the option chain, open interest helps answer these questions:
- which strikes have high concentration of positions
- whether that concentration is on the call side or the put side
- whether fresh positions are being added or reduced
A high OI number alone is not enough. It should always be read with:
- the side of the chain
- the distance from spot price
- change in OI
- nearby strike activity
That is why OI should always be read in context.
For readers who want to strengthen the basics before going deeper into the option chain, it is useful to understand the core meaning of open interest and the difference between call and put options. That foundation makes option-chain reading much easier.
Key option chain fields and what they mean
| Field | What it shows | Why it matters |
|---|---|---|
| Strike Price | The price level of the option contract | Helps identify important zones in the chain |
| Call OI | Open call positions at a strike | Useful for reading call-side concentration |
| Put OI | Open put positions at a strike | Useful for reading put-side concentration |
| Change in Call OI | Addition or reduction in call positions | Helps identify fresh call-side activity |
| Change in Put OI | Addition or reduction in put positions | Helps identify fresh put-side activity |
| Volume | Number of contracts traded | Helps show whether activity is active or stale |
| LTP | Current option premium | Useful, but should not be read on its own |
How to read call-side open interest
Call-side OI is generally watched at strikes above the current market price. High call OI at a strike often points to an important overhead zone.
This is why traders monitor these strikes carefully. If call-side concentration is high near spot, the upside can become crowded. If fresh call OI additions are also strong at that strike, the level becomes even more relevant.
Practical reading of call OI
- high call OI above spot often points to an important resistance area
- strong fresh call additions near spot suggest active overhead pressure
- older high call OI without fresh additions may still matter, but may not be the strongest current signal
- nearby strikes deserve more attention than distant strikes
What this does not mean
High call OI does not automatically mean the market must fall. It only shows that a strike is important on the call side.
How to read put-side open interest
Put-side OI is usually watched at strikes below the current market price. High put OI at a strike often points to an important support zone.
When traders see strong put-side concentration below spot, they usually treat that level as a possible downside base. If fresh put additions are also visible at a nearby strike, that support view becomes stronger.
Practical reading of put OI
- high put OI below spot often points to an important support area
- rising put OI near spot may indicate stronger immediate support
- older put OI with weak fresh addition may still matter, but should be compared with current activity
- nearby strikes are usually more useful than distant strikes
What this does not mean
High put OI does not guarantee that support will hold. It only shows where visible put-side concentration exists.
Why change in OI matters so much
A common mistake in option-chain reading is to focus only on total OI. That gives an incomplete view.
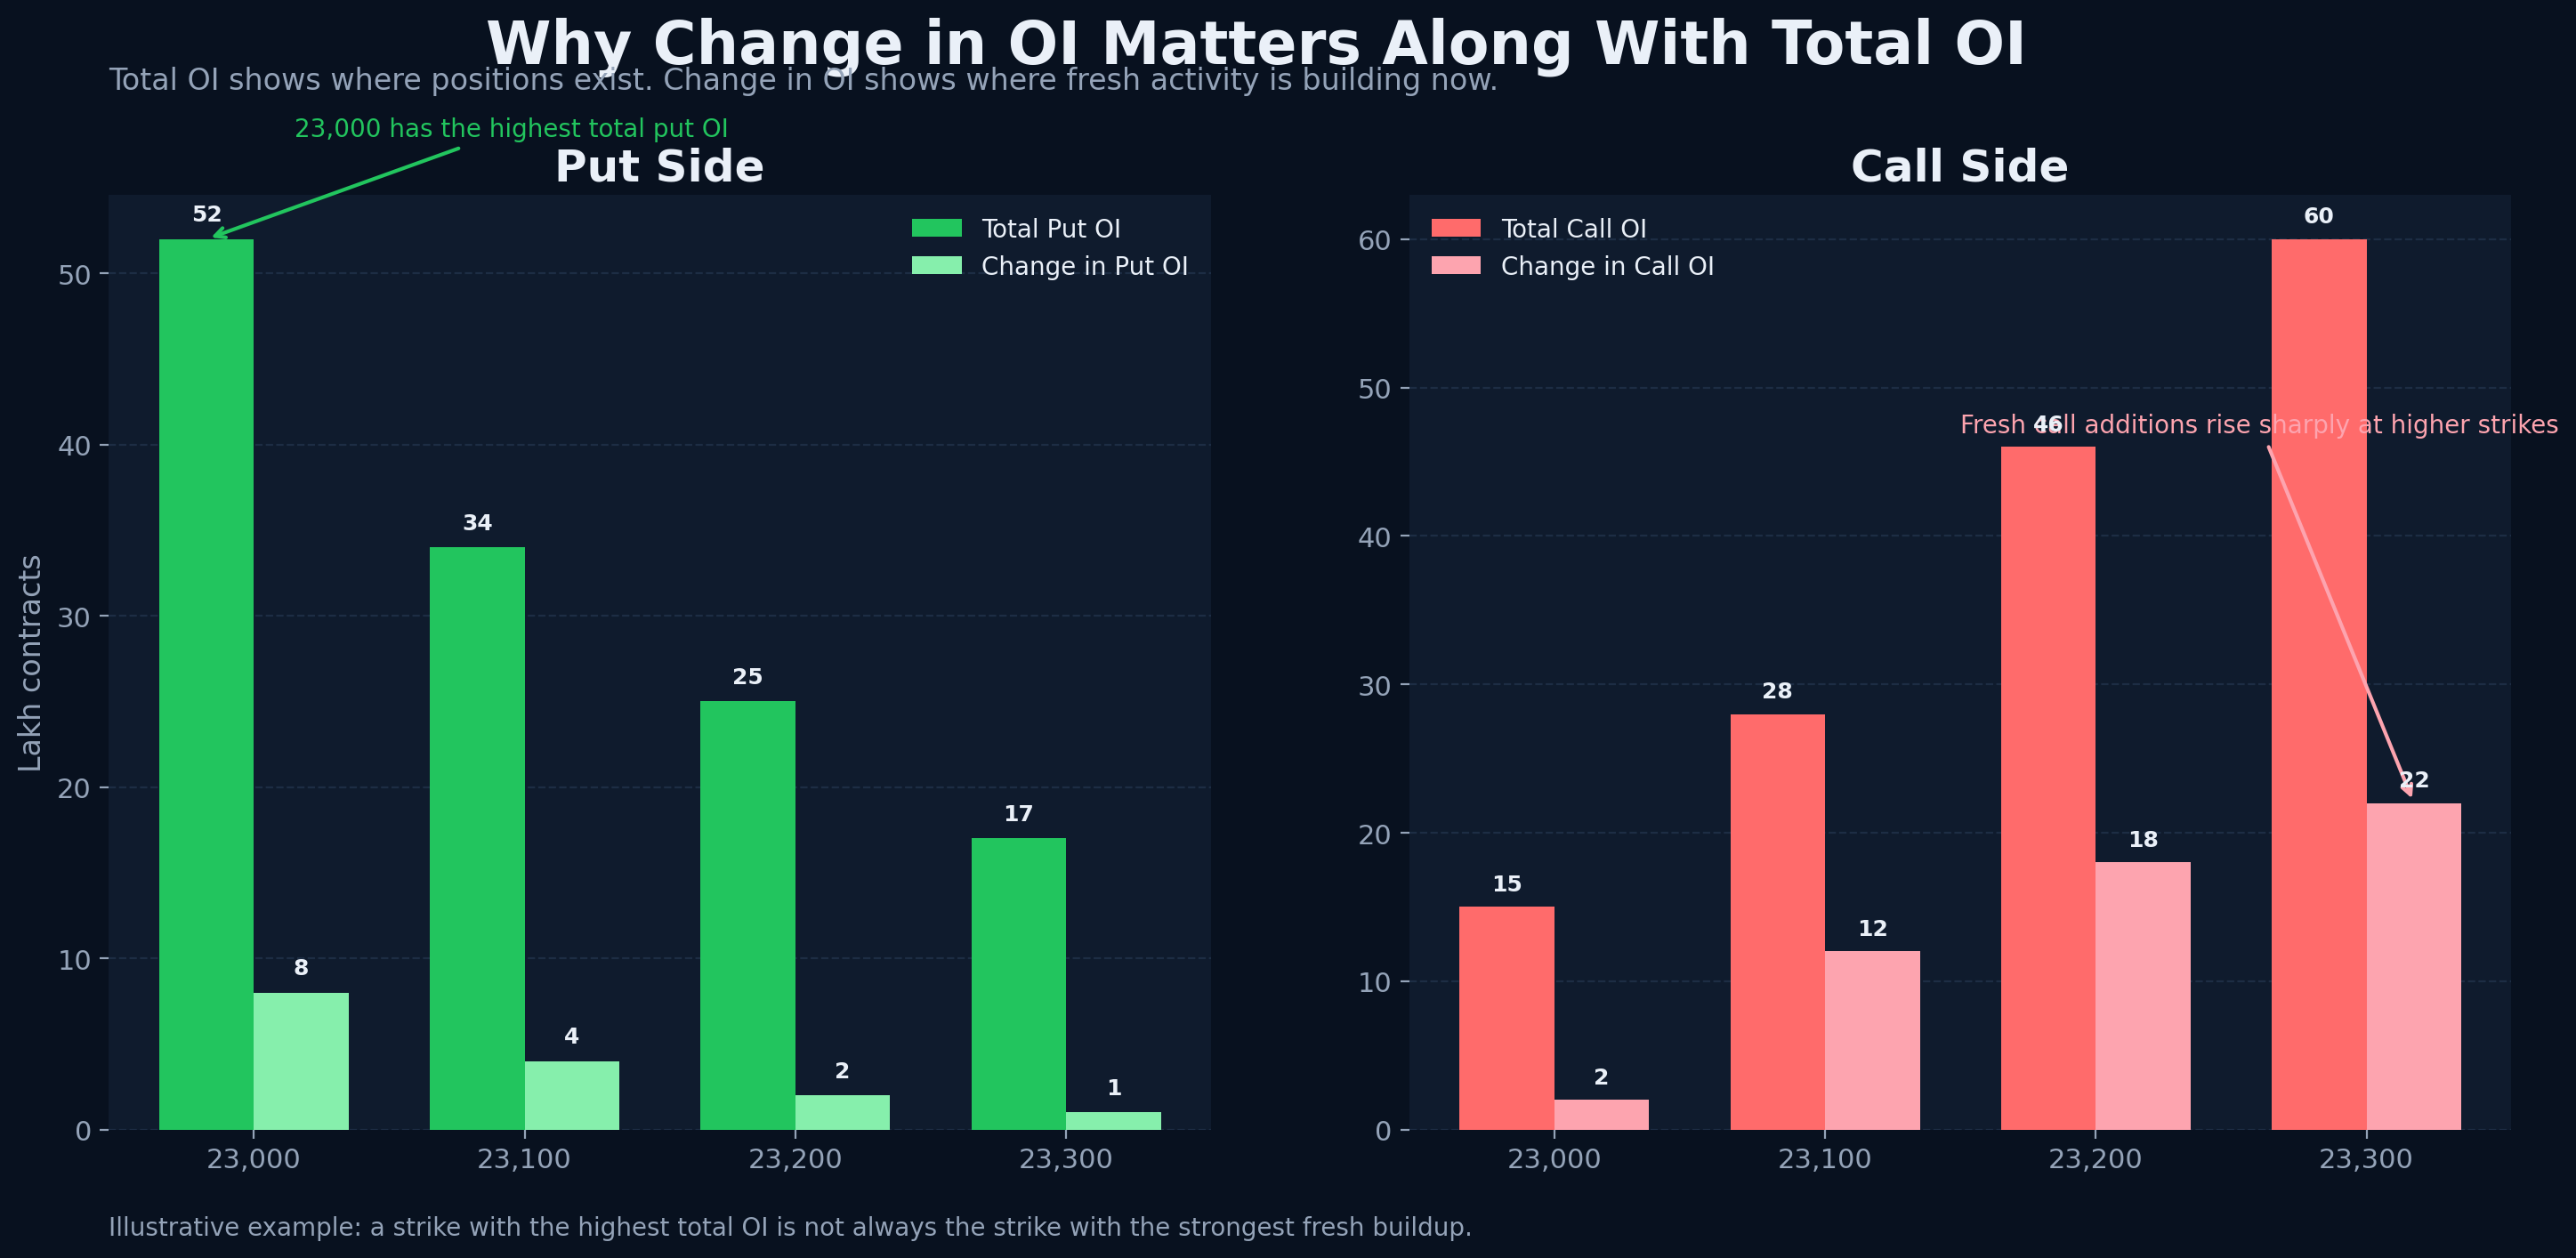
Total OI tells us where positions already exist.
Change in OI tells us where new positions are being added or reduced.
This difference is very important.
A strike may still have the highest total OI in the chain, but if fresh positions are shifting to a nearby strike, the newer strike may matter more for the current structure.
A simple way to think about it
- total OI = where positions are already standing
- change in OI = where fresh interest is building now
That is one of the key principles in how to read option chain using open interest properly.
The chart below is useful here because it compares total OI and change in OI side by side. The idea is simple: the strike with the biggest total OI is not always the strike with the strongest fresh activity.
Change in OI vs total OI in practical reading
| Observation | Likely reading | What to check next |
|---|---|---|
| High total call OI but weak fresh change | The strike may be an older resistance zone | Check if a nearby strike is seeing stronger fresh call additions |
| High total put OI but weak fresh change | The strike may be an older support zone | Check whether support is shifting closer to spot |
| Strong fresh call additions near spot | Overhead pressure may be building actively | Compare with price action and nearby strikes |
| Strong fresh put additions near spot | Immediate support may be getting stronger | Check whether the market is holding above that band |
| OI reducing at an important strike | The level may be losing relevance | Look at the next nearby strike with active buildup |
How to identify important strikes in the option chain
Not every strike deserves equal attention. A better approach is to filter the chain.
Step 1: Start with spot price
The spot price tells you which strikes are closest to the market.
Step 2: Mark the top call OI strikes
These are usually the first overhead levels to watch.
Step 3: Mark the top put OI strikes
These are usually the first support levels to watch.
Step 4: Mark the biggest fresh call additions
These show where new call-side pressure is building.
Step 5: Mark the biggest fresh put additions
These show where new put-side support is building.
Step 6: Give more weight to nearby strikes
A nearby strike with strong fresh OI change is often more useful than a distant strike with parked OI.
Example of option chain reading using OI
The table below is a simple example to explain the method.
| Strike | Call OI | Change in Call OI | Put OI | Change in Put OI | Reading |
|---|---|---|---|---|---|
| 22,900 | 12 lakh | +1 lakh | 38 lakh | +2 lakh | Support exists, but fresh buildup is limited |
| 23,000 | 15 lakh | +2 lakh | 52 lakh | +8 lakh | Strong support zone with fresh put activity |
| 23,100 | 28 lakh | +12 lakh | 34 lakh | +4 lakh | Active transition zone near spot |
| 23,200 | 46 lakh | +18 lakh | 25 lakh | +2 lakh | Strong call concentration above spot |
| 23,300 | 60 lakh | +22 lakh | 17 lakh | +1 lakh | Clear overhead call-side pressure |
In this example:
- 23,000 looks like a stronger support zone because put OI is high and fresh put additions are also strong.
- 23,200 and 23,300 look important on the upside because call OI is high and fresh call additions are visible.
- 23,100 may act as a transition strike because activity is visible on both sides.
This is how option-chain reading becomes practical. The goal is not to predict every move. The goal is to identify where the important pressure zones are.
How traders use OI to estimate support and resistance
Open interest is widely used to estimate possible support and resistance zones.
A simple working framework is:
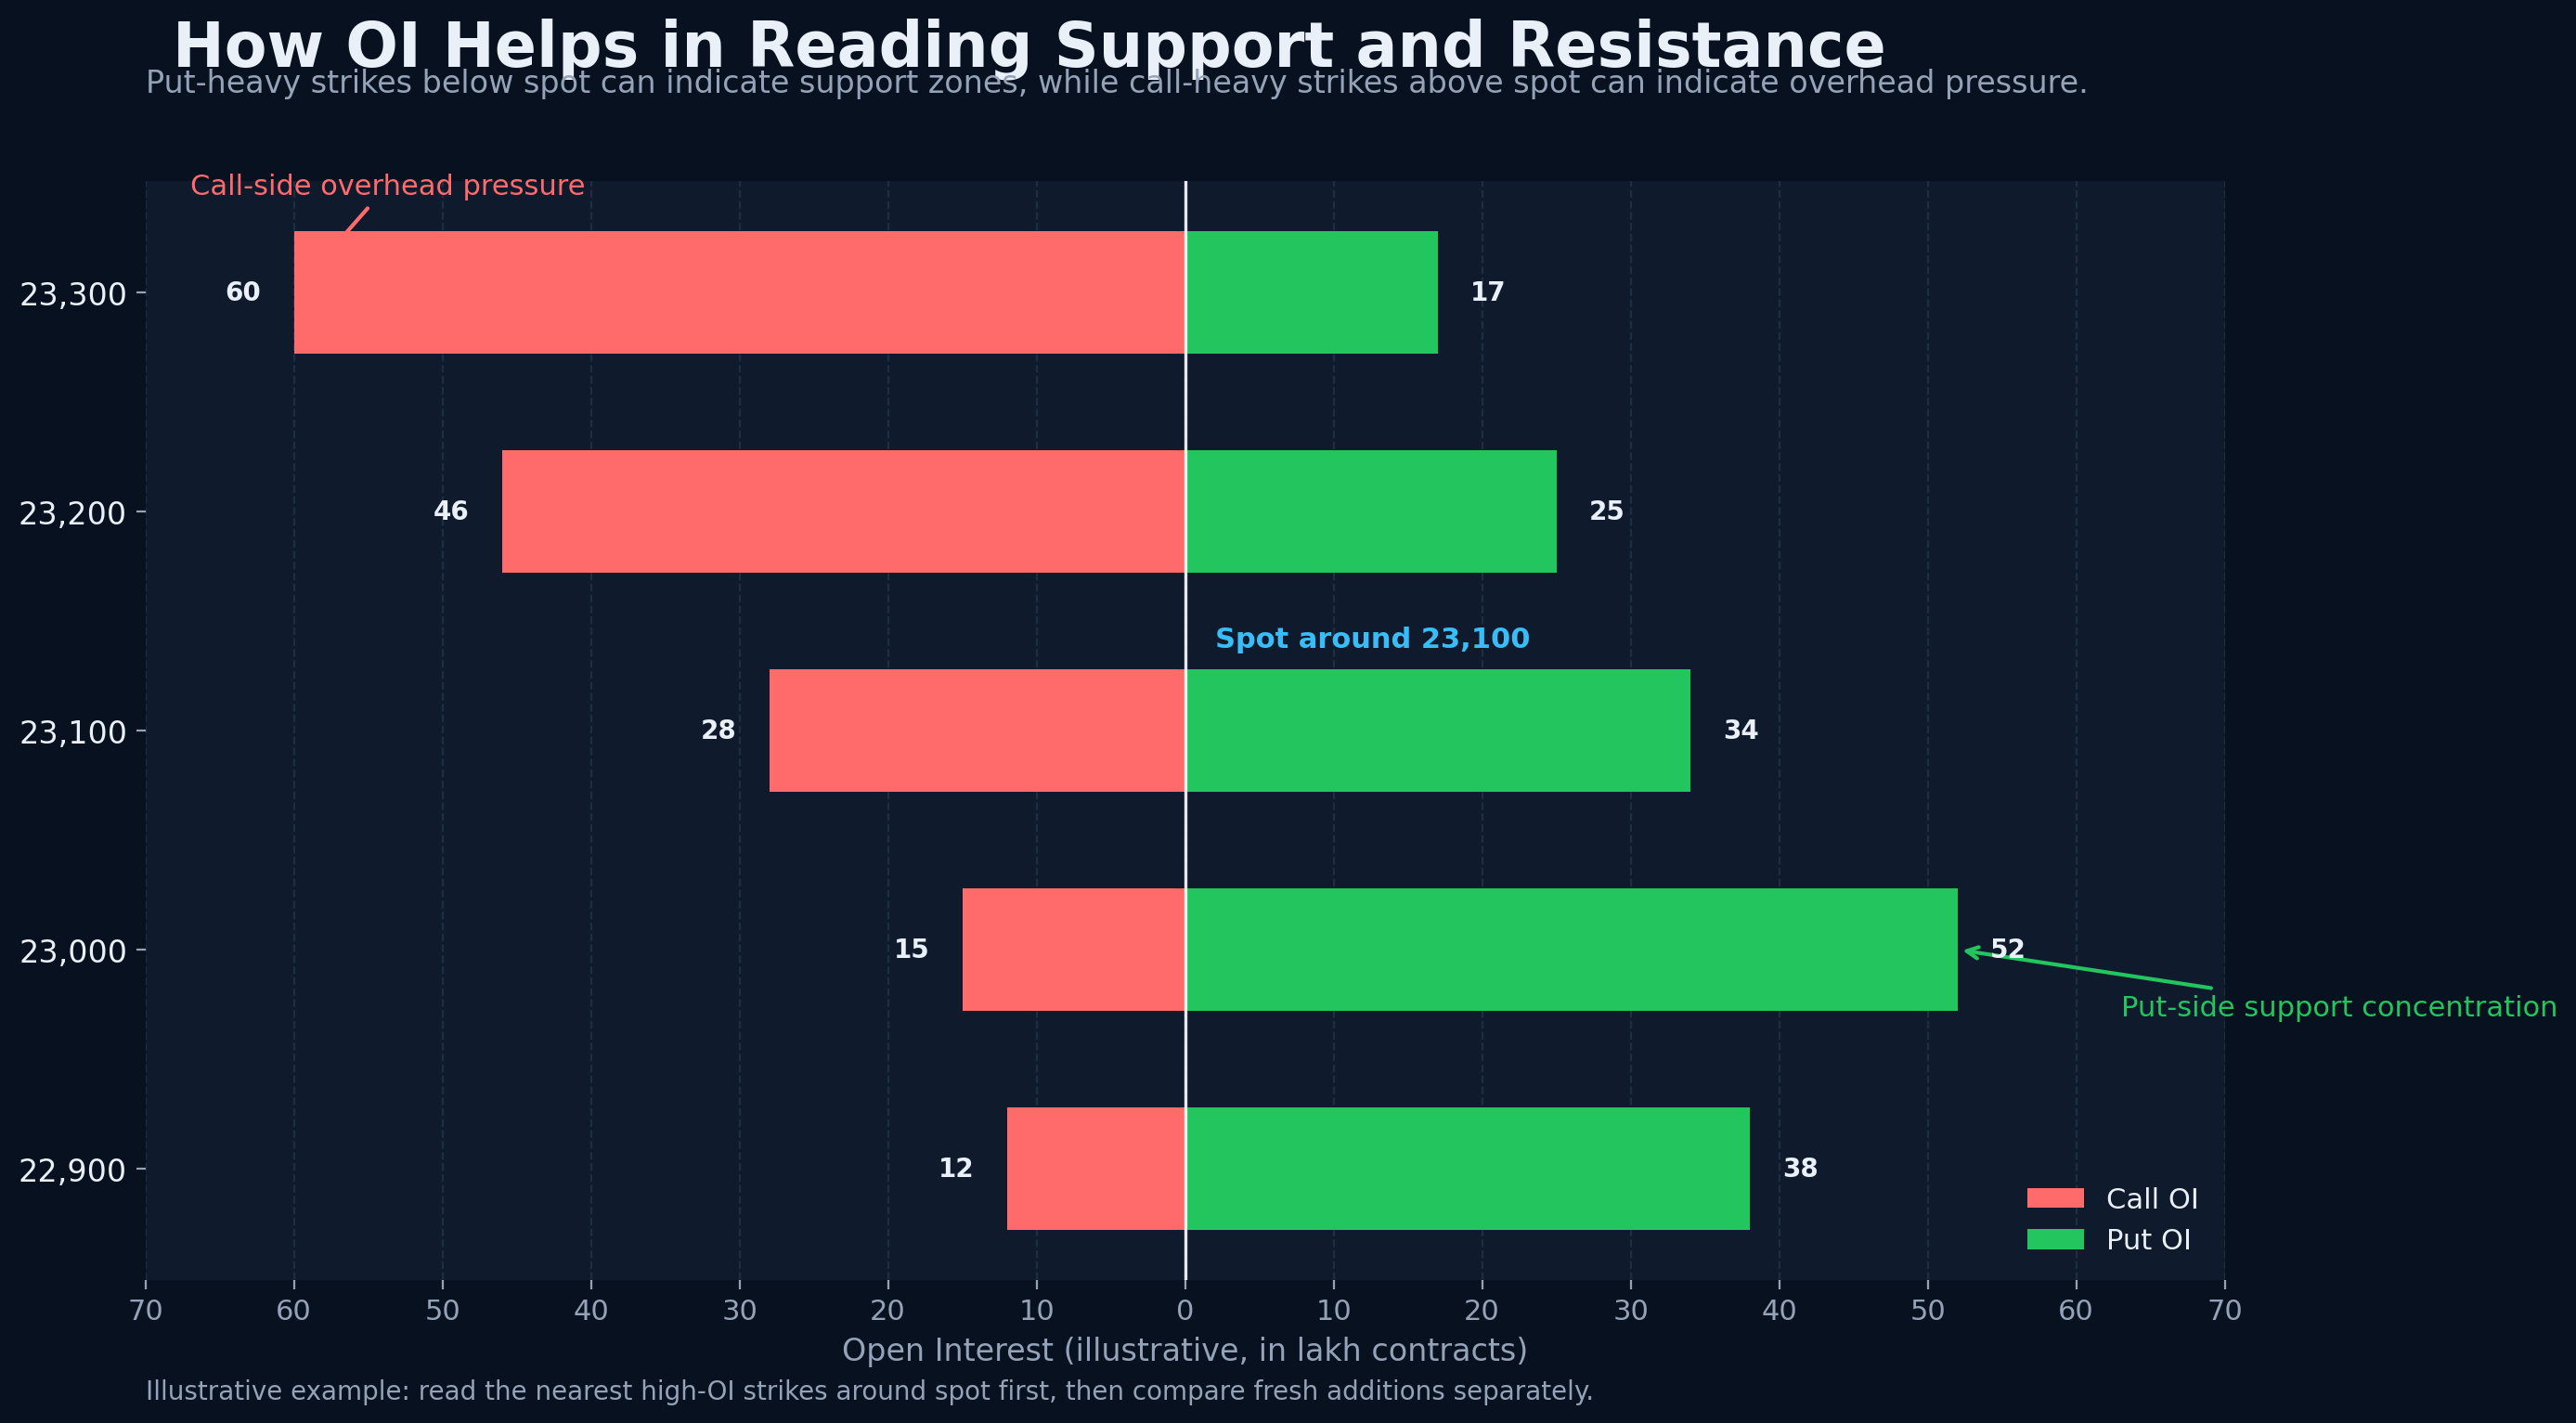
- put-heavy strikes below spot often act as support zones
- call-heavy strikes above spot often act as resistance zones
- fresh additions near spot matter more than distant strikes
- clusters of nearby strikes are often more important than one isolated number
This does not mean OI levels always hold. It means they are useful zones of market interest.
The support-resistance chart below should be read as an illustrative structure. Put-heavy strikes below spot form the support side of the map, while call-heavy strikes above spot form the overhead pressure side.
Common mistakes while reading option chain using open interest
| Mistake | Why it is weak | Better reading approach |
|---|---|---|
| Looking only at the highest OI strike | Total OI alone may reflect old positions | Compare total OI with change in OI |
| Ignoring spot price | Far-away strikes may look important but may not matter now | Start with strikes near the market |
| Treating call OI as an automatic sell signal | High call OI is a structure clue, not certainty | Read it with price and fresh activity |
| Treating put OI as guaranteed support | Support can weaken if OI shifts or unwinds | Check whether fresh put buildup is still active |
| Ignoring volume | OI without activity may be stale | Use volume as a supporting filter |
| Reading one strike in isolation | Market structure usually forms in zones | Read nearby strikes together |
A simple workflow to read option chain using open interest
A practical five-step method is enough for most readers.
1. Note the current spot price
Without spot price, the chain has no proper context.
2. Mark the top call OI and top put OI strikes
This creates the first support-resistance map.
3. Check change in OI at nearby strikes
This shows whether support or pressure is building now.
4. Compare nearby strikes instead of chasing only the biggest number
The nearest active strikes are often more useful than distant parked OI levels.
5. Read the overall structure
Ask simple questions:
- is support shifting upward?
- is call pressure building closer to spot?
- is the structure balanced in a range?
- is one side clearly stronger than the other?
What this article does not fully cover
This article explains the practical reading process, but some related topics deserve separate detailed articles, such as:
- support and resistance using OI
- OI vs volume
- call writing vs put writing
- PCR
- max pain
- detailed price + OI interpretation
Keeping these topics separate is useful because each one has its own search intent and deserves a proper treatment.
Conclusion
Option-chain analysis becomes much more useful when open interest is read correctly.
The most practical way to read option chain using open interest is to combine:
- total OI
- change in OI
- distance from spot
- nearby strike clusters
- basic market context
That gives a much better reading than looking at option premiums alone.
Once this foundation is clear, the next logical step is to understand how open interest helps in finding support and resistance more precisely.
