Many traders see both total OI and change in OI in the option chain, but still do not know which one deserves more attention.
That confusion is common.
A strike may show very high total OI, but only a small fresh addition in the current session. Another strike may show lower total OI, but much stronger change in OI. So which one matters more?
The answer is not that one is right and the other is wrong. They answer different questions.
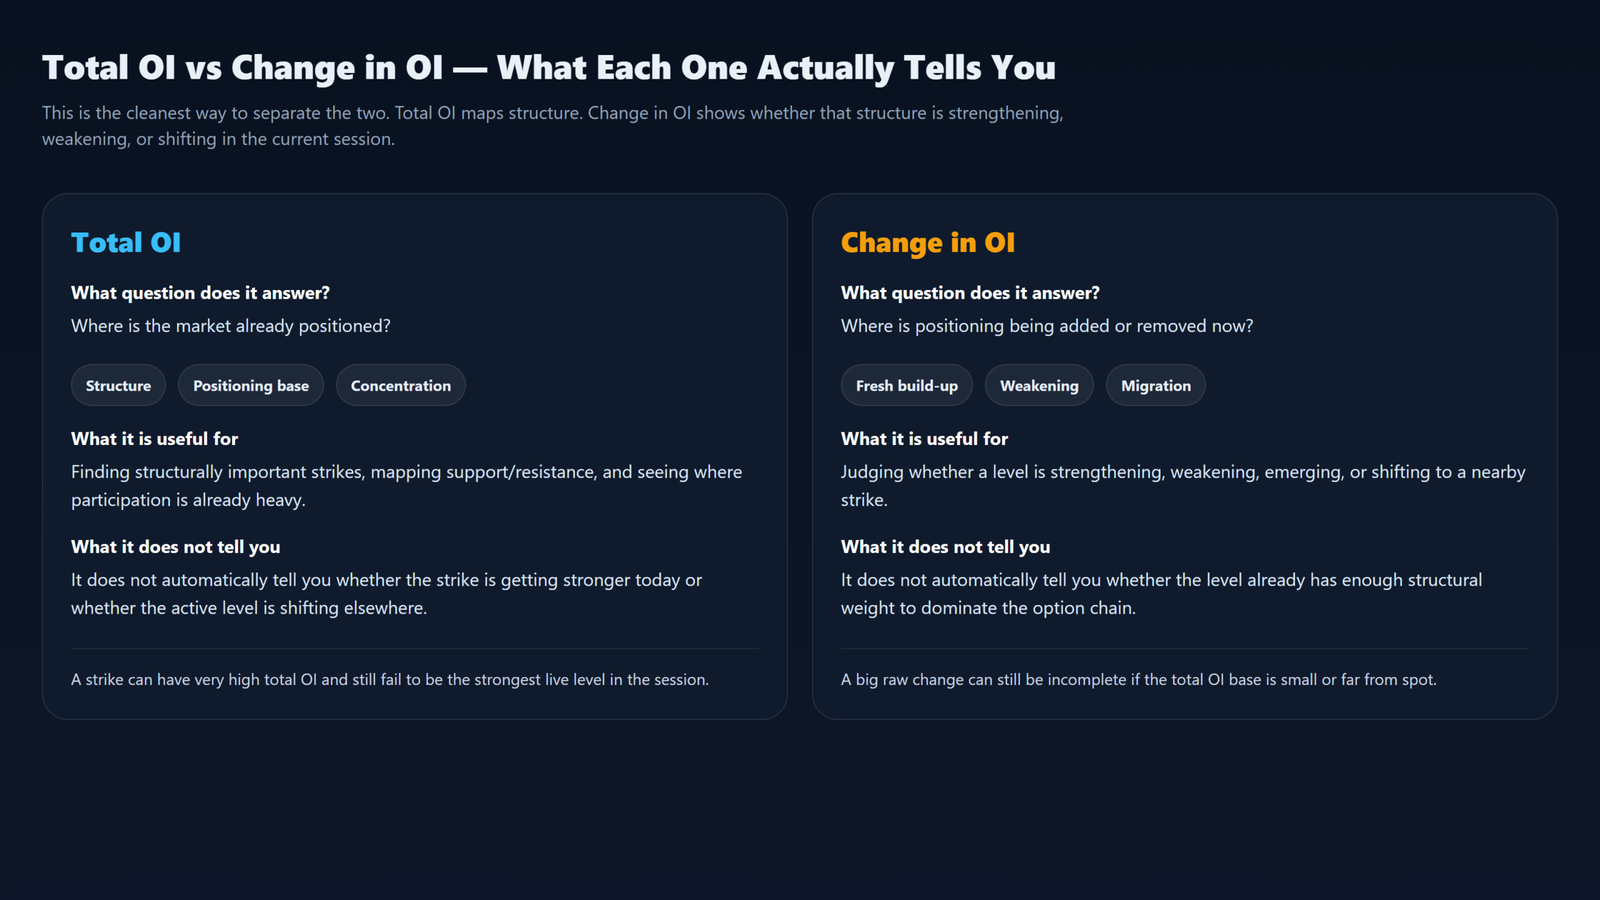
- Total OI tells you where the market is already positioned.
- Change in OI tells you where positioning is being added or removed now.
That is the most practical way to understand the difference.
In simple terms:
– total OI shows structure
– change in OI shows whether that structure is strengthening, weakening, or shifting
What total OI means in the option chain
Total OI shows the number of positions that remain open at a strike.
It is a standing number. It tells you how much participation is already present at that strike.
What total OI is useful for
- identifying strikes with large positioning concentration
- spotting possible support and resistance zones
- understanding which strikes already matter structurally
- comparing where participation is heavier across nearby strikes
What total OI does not tell you on its own
- whether the strike is strengthening today
- whether fresh positions are being added aggressively now
- whether traders are reducing interest at that level
- whether the level is shifting to another strike
This is the first big mistake traders make. They treat the largest total OI number as if it gives the full story.
It does not.
A strike can have large total OI because it mattered earlier. That does not automatically mean it is the strongest live level in the current session.
What change in OI means in the option chain
Change in OI shows the increase or decrease in open interest compared with the earlier reference point, usually the previous session.
It is a flow measure, not a standing measure.
What change in OI is useful for
- spotting fresh build-up
- identifying unwinding or reduction
- seeing whether a strike is strengthening or weakening
- detecting whether positioning is shifting to nearby strikes
What change in OI does not tell you on its own
- whether the strike already carries meaningful total positioning
- whether the level is structurally important by itself
- whether a large raw change is meaningful relative to the existing OI base
This is the second major mistake traders make. They see a big rise in change in OI and assume the strike has become the most important level, even when total OI is still small.
Change in OI vs total OI — the actual difference
The cleanest way to separate the two is this:
| Metric | What it measures | What it answers |
|---|---|---|
| Total OI | Open contracts still standing at a strike | Where is the market already positioned? |
| Change in OI | Increase or decrease in OI versus the earlier reference point | Where is positioning being added or removed now? |
A simple line to remember is:
Total OI shows the size of the existing crowd. Change in OI shows whether that crowd is growing or shrinking.
Which matters more?
This is the most practical question.
The answer depends on what the trader wants to understand.
If the goal is to identify structure
Total OI usually matters more first.
That is because structure is linked to where meaningful positions already exist. When traders want to identify support and resistance using open interest, total OI is usually the first thing they check.
If the goal is to judge what is changing in the current session
Change in OI matters more.
That is because change in OI helps answer questions like:
– is this level strengthening?
– is this level weakening?
– are traders shifting interest to another strike?
Practical rule
- use total OI to find the level
- use change in OI to judge whether the level is strengthening, weakening, or shifting
That is the simplest working rule for most option-chain readers.
Why high total OI can still be a stale reading
A strike with huge total OI often looks very important. Sometimes it is. But not always.
A strike can carry large total OI because:
– positions were built earlier
– it mattered in a previous session
– the level accumulated writing over time
– the strike is far OTM but still carries legacy positioning
If fresh OI addition there is weak, flat, or negative, the level may be old rather than strengthening.
Practical meaning
High total OI with weak fresh build-up often means:
– the strike is structurally visible
– but it may not be getting stronger right now
This is why a large old wall and a strengthening current wall are not always the same thing.
Why big change in OI can still be incomplete
The opposite problem also happens.
A strike can show strong change in OI, but total OI there may still be small.
This often means:
– the strike is emerging
– fresh attention is building there
– but the level may not yet be the strongest structural strike
Practical meaning
Large positive change in OI with low or moderate total OI often means:
– the level is becoming important
– but it may still be weaker than an already-established strike with much larger total OI
That is why change in OI should not be read alone.
Why relative change matters more than most traders realise
This is one of the most useful ideas in the topic.
Many traders compare raw change in OI numbers without comparing the base. That can lead to weak interpretation.
Example
| Strike | Total OI | Change in OI | Reading |
|---|---|---|---|
| 23,000 | 50 lakh | +5 lakh | Good fresh addition to an already strong level |
| 23,100 | 12 lakh | +4 lakh | Smaller total base, but much faster fresh build-up proportionately |
A trader who only looks at the raw change may think the first strike is automatically more important.
But the second strike may actually be seeing a much faster build-up relative to its earlier base.
Better question
Instead of asking only:
– how much did OI change?
Ask:
– how much did it change compared with the existing OI base?
That is a much better way to read the option chain.
Nearby strikes usually deserve more attention than distant giant OI numbers
This is another common mistake.
A distant strike may show very large total OI, but that does not always make it the most actionable level for the current session.
A nearer strike with:
– lower total OI
– stronger fresh change in OI
– greater relevance to the live spot price
may matter more in actual trading.
Better reading order
- note the current spot price
- focus on nearby strikes first
- compare total OI at those strikes
- compare change in OI at those strikes
- then check whether farther strikes still matter structurally
This is a much better process than simply ranking strikes by the largest raw number in the chain.
How change in OI helps detect strengthening, weakening, or migration
This is where change in OI becomes especially useful.
Strengthening
If a strike already has high total OI and change in OI is also rising, the level may be strengthening.
Weakening
If total OI is still high but change in OI turns negative, the level may be weakening.
Migration
If OI reduces at one strike and rises at the next nearby strike, the level may be shifting rather than holding.
This is a much richer interpretation than simply saying:
– highest call OI is resistance
– highest put OI is support
Sometimes the more useful question is:
Is the market defending the same level, abandoning it, or shifting to another strike?
Change in OI helps answer that.
Support and resistance reading — how the two work together
In practical option-chain reading, both numbers matter.
On the call side
- high total call OI can signal an existing resistance zone
- rising call change in OI can suggest resistance is strengthening
- falling call change in OI can suggest resistance is weakening or shifting
On the put side
- high total put OI can signal an existing support zone
- rising put change in OI can suggest support is strengthening
- falling put change in OI can suggest support is weakening or shifting
This becomes easier to follow when traders understand how calls and puts at different strikes behave in the option chain.
Total OI and change in OI should not be read without context
The strongest reading comes from combining both with context.
That context includes:
– spot price
– distance from spot
– price action
– volume
– session type
– expiry context
For example, if you also compare open interest with volume, the interpretation becomes stronger:
- high volume + strong change in OI = fresh participation is likely meaningful
- high volume + flat OI change = heavy churn, not necessarily strong new positioning
- weak volume + isolated OI change = better to avoid over-reading one number
A practical interpretation matrix
| Situation | Likely reading | Practical takeaway |
|---|---|---|
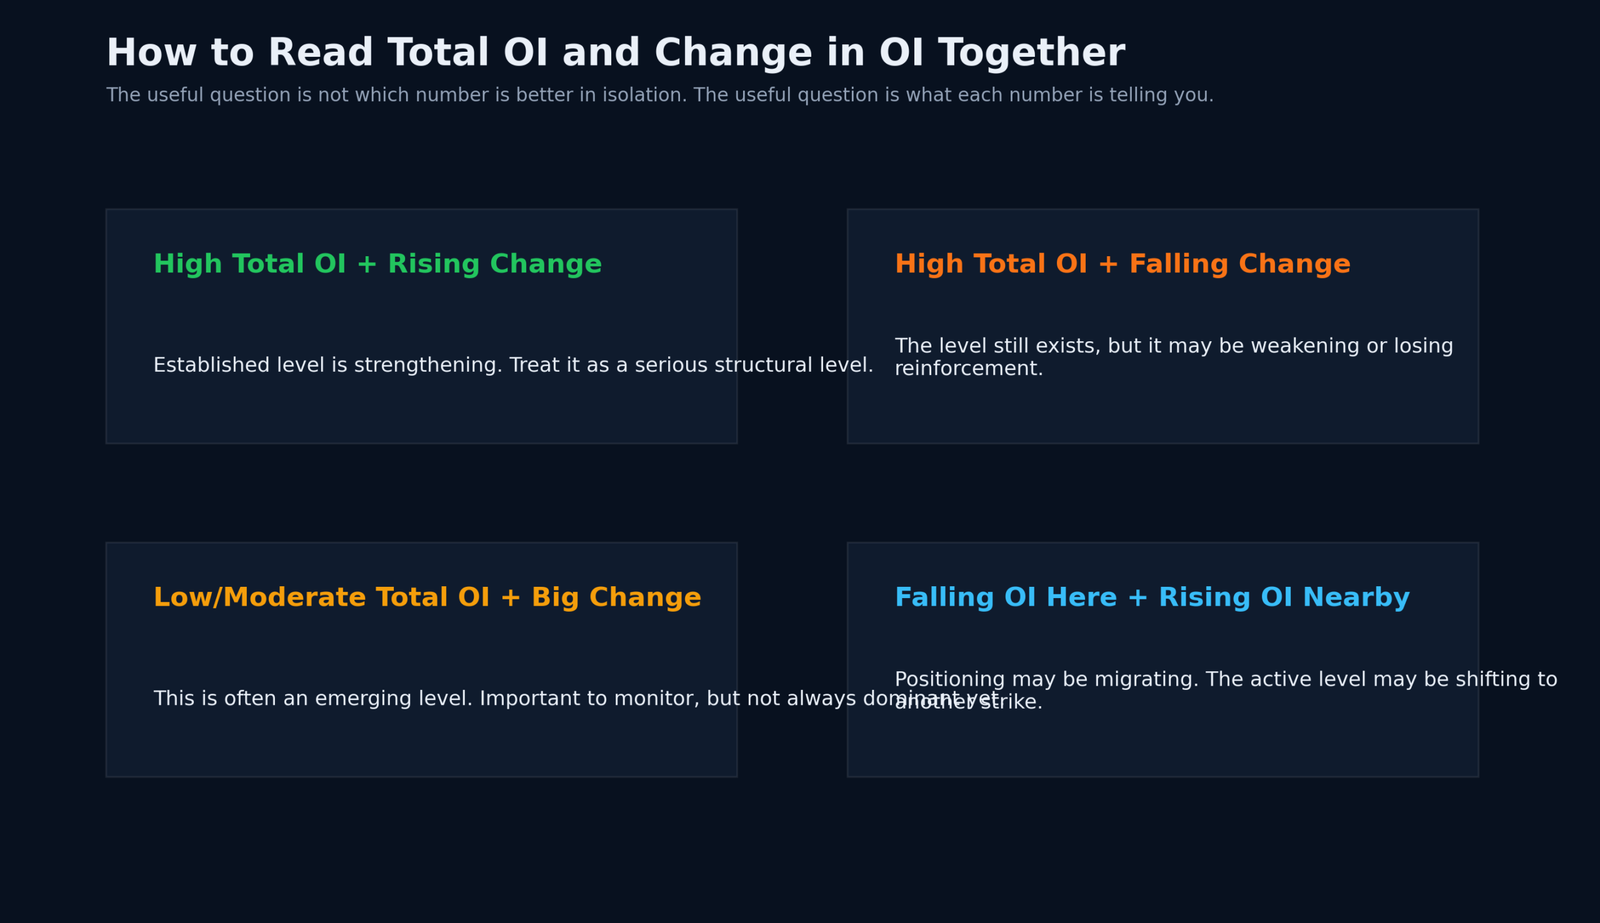
| High total OI + rising change in OI | Established level is strengthening | Treat the level seriously |
| High total OI + falling change in OI | Existing level is visible, but weakening | Watch for weakening structure or shift |
| Low or moderate total OI + large positive change in OI | Emerging level | Important to monitor, but not yet the strongest level |
| Huge total OI far from spot + weak fresh change | Old or distant structure | Do not over-prioritise it for immediate trading |
| Nearby strike + moderate total OI + strong fresh change | Active developing level | Often more actionable than a distant high-OI strike |
| High volume + flat OI change | Heavy activity without strong fresh build-up | Could be churn rather than conviction |
Example: resistance may be shifting upward
The table below is illustrative.
| Strike | Call Total OI | Change in Call OI | Practical reading |
|---|---|---|---|
| 23,300 | 46 lakh | -3 lakh | Existing resistance may be weakening |
| 23,400 | 38 lakh | +9 lakh | Resistance may be strengthening here |
| 23,600 | 60 lakh | +1 lakh | Large old wall, but not necessarily the strongest live barrier |
What this table suggests
- 23,600 still has the biggest total call OI, so it cannot be ignored.
- But 23,400 may be the more relevant live resistance because fresh build-up is stronger there.
- 23,300 may be losing some importance if OI is reducing.
This is how change in OI helps detect migration.
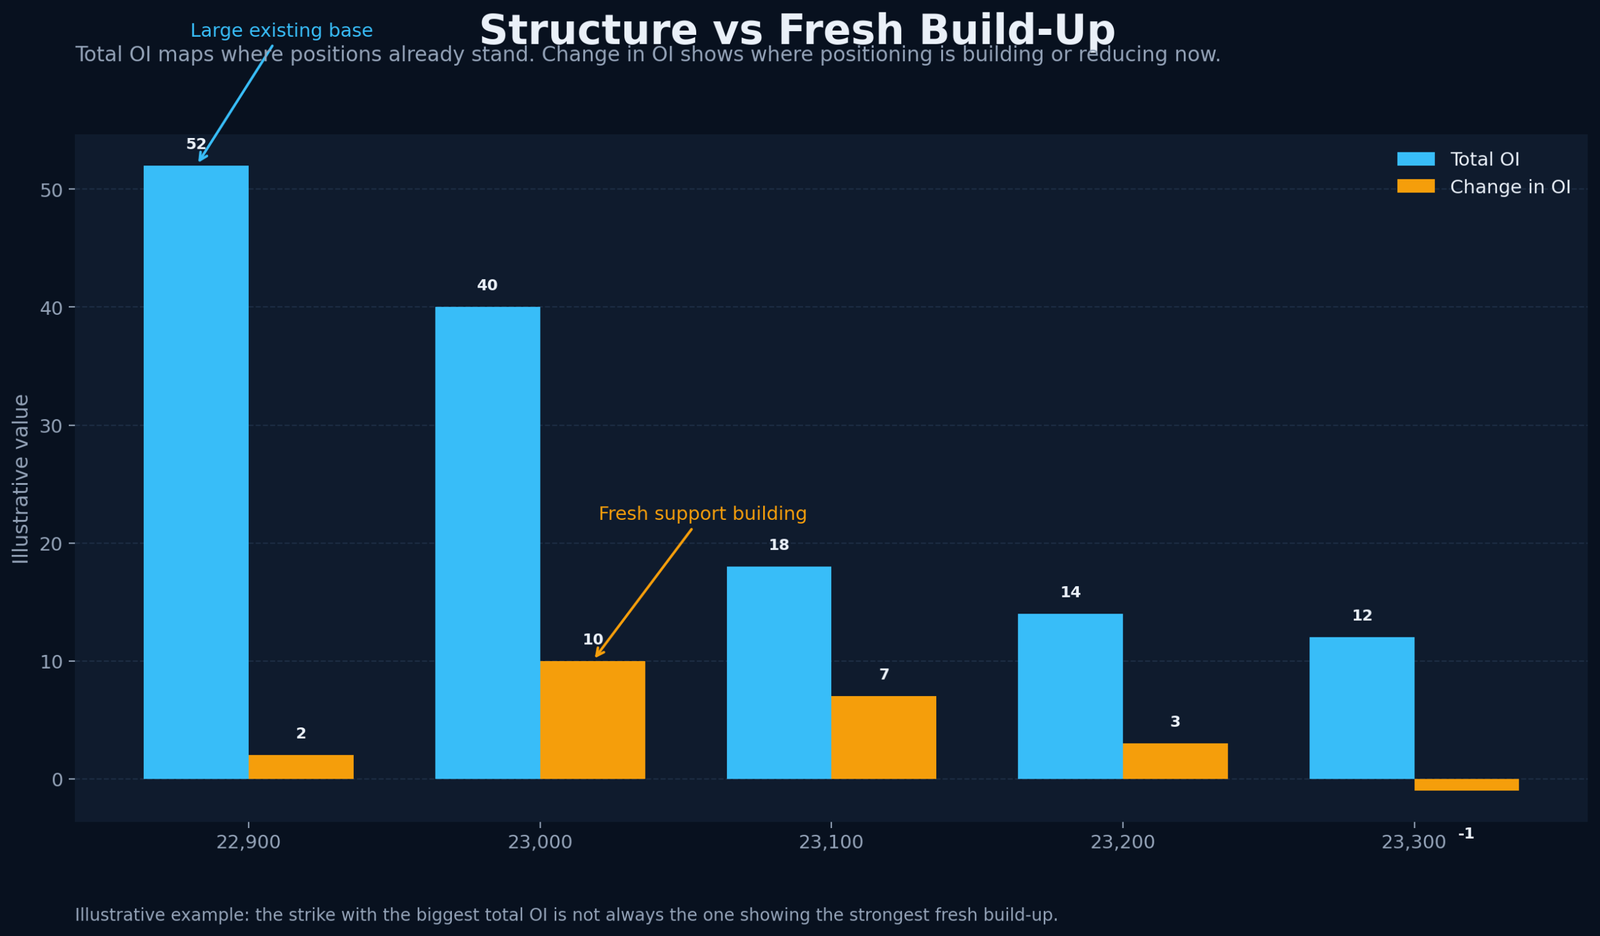
Example: support may be building closer to spot
| Strike | Put Total OI | Change in Put OI | Practical reading |
|---|---|---|---|
| 22,900 | 52 lakh | +2 lakh | Existing support remains visible |
| 23,000 | 40 lakh | +10 lakh | Fresh support is building strongly |
| 22,700 | 61 lakh | 0 | Large historical base, but not the key live level |
What this table suggests
- 22,700 may still look strong if a trader checks only total OI.
- But 23,000 may matter more in the current session because it is nearer to the live market and fresh put build-up is stronger there.
This is why nearby relevance matters.
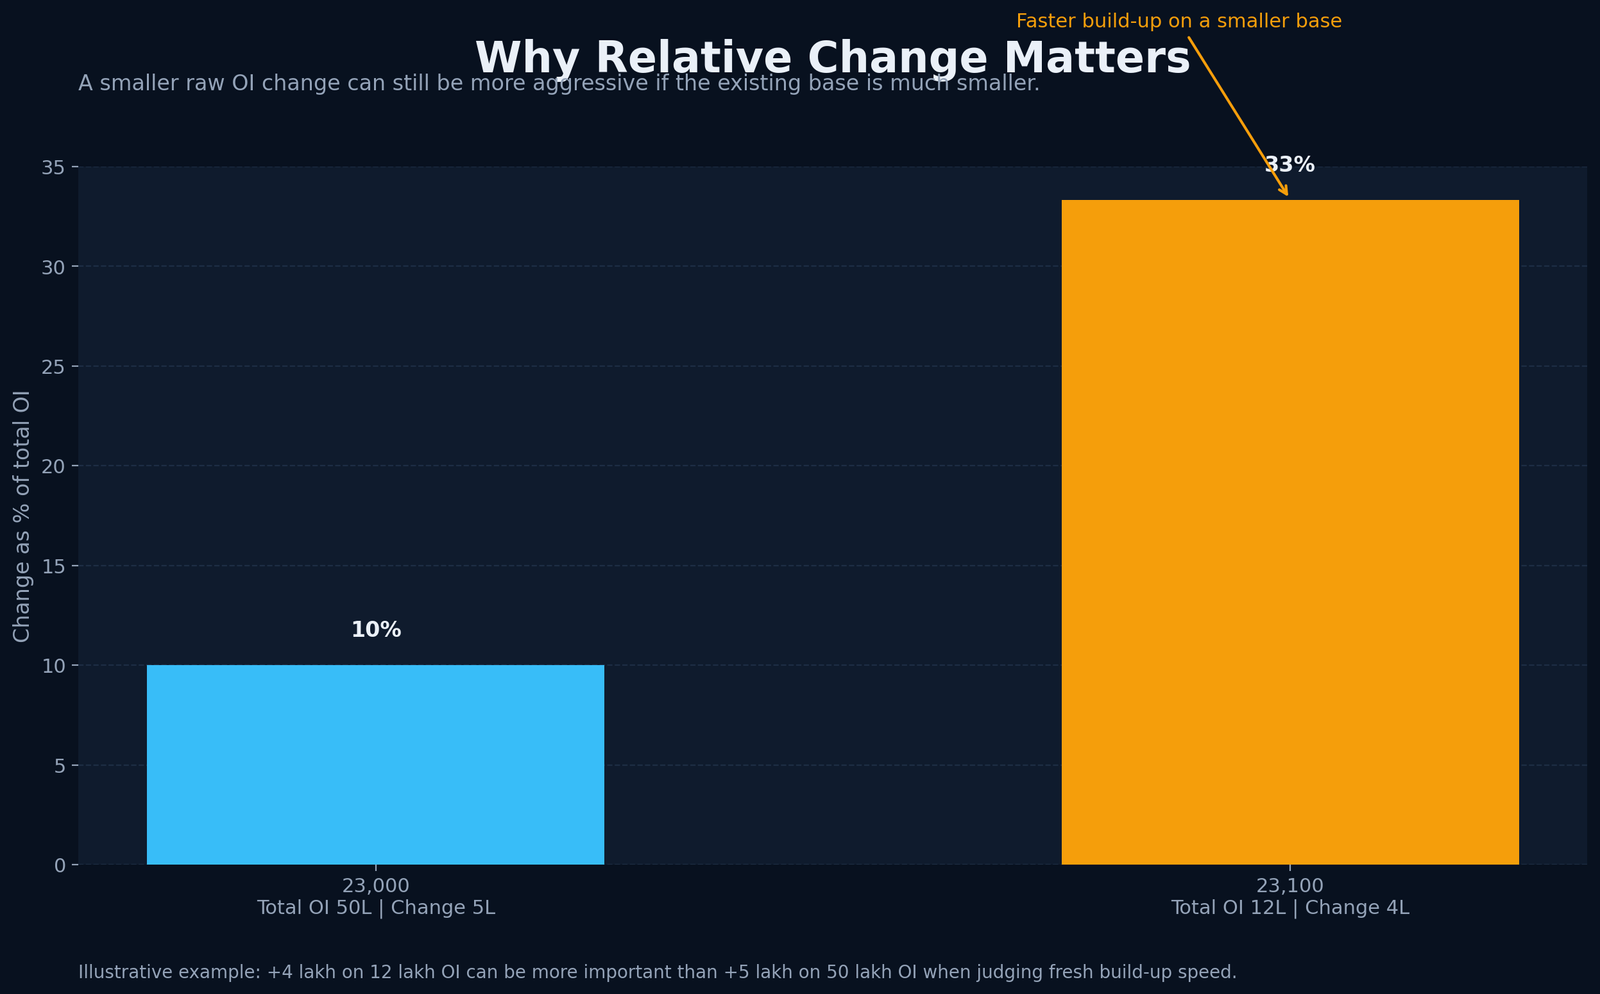
Example: why relative change matters
| Strike | Total OI | Change in OI | Change as % of total OI | Practical reading |
|---|---|---|---|---|
| 23,000 | 50 lakh | +5 lakh | 10% | Established level with moderate fresh addition |
| 23,100 | 12 lakh | +4 lakh | 33% | Faster fresh build-up, but on a smaller base |
What this table shows
A raw comparison of +5 lakh and +4 lakh is not enough.
The second strike is growing much faster relative to its earlier base. That does not automatically make it the dominant level, but it does make it important to monitor.
Common mistakes traders make with total OI and change in OI
| Mistake | Why it is weak | Better reading |
|---|---|---|
| Treating highest total OI as the full story | Old structure may no longer be strengthening | Compare fresh change in OI too |
| Treating biggest OI change as the strongest level | The total base may still be small | Compare both total OI and change in OI |
| Ignoring spot distance | Far strikes may look large but matter less now | Prioritise nearby strikes first |
| Ignoring migration | Levels can shift from one strike to another | Watch adjacent-strike changes |
| Ignoring relative change | Raw OI change alone can mislead | Compare change against the total base |
| Ignoring volume or session context | Fresh participation may be overstated | Read OI with price, volume and context |
A simple workflow for reading total OI and change in OI together
Use this workflow if you want to read the option chain in a structured way.
1. Start with spot price
Without spot price, strike-wise OI numbers lose context.
2. Mark nearby strikes with meaningful total OI
These are your first structural levels.
3. Compare change in OI at those strikes
This helps show whether the structure is strengthening, weakening, or shifting.
4. Check adjacent strikes for migration
If OI is reducing at one level and building at another, the market may be shifting its active zone.
5. Use price and volume as confirmation
This improves interpretation and reduces over-reading.
6. Decide whether the strike is established, emerging, weakening, or shifting
That final classification makes the chain much easier to read.
A note on expiry context
Near expiry, change in OI can become noisier.
That happens because:
– squaring off increases
– positions shift faster between nearby strikes
– intraday churn rises
– traders adjust aggressively
So isolated change in OI numbers should not be treated with the same confidence in every session.
The closer the expiry, the more important it becomes to:
– focus on nearby strikes
– watch migration across adjacent levels
– avoid over-reading one large number in isolation
Conclusion
Total OI and change in OI are not competing signals. They are complementary.
The clearest way to think about them is this:
– total OI tells you where the market is already positioned
– change in OI tells you where positioning is being added or removed now
In practice:
– use total OI to map the level
– use change in OI to judge whether the level is strengthening, weakening, or shifting
– use spot relevance, price action and volume to improve the reading further
That approach is much more reliable than following the biggest raw number on the option chain.
